🌲 Canopy Height Model (CHM) — per-location benchmark (v.2026-08-31)
This page details the Canopy Height Model (CHM) produced by the 🌲 Forest and trees Height estimation option. CHM v.2026-08-31 is compared against CHM v.2026-07-03 on the most-improved sample per country, using lidar-derived ground truth aggregated to 5 m hexagons (max height).
The metric is the mean absolute error (MAE) of canopy height, in metres, against the lidar ground truth. Across 38 areas of interest, CHM v.2026-08-31 lowers the mean MAE from 4.70 m to 3.24 m (−31%) versus CHM v.2026-07-03, with the largest gains in tall, structurally complex forest.
🇷🇺 Russia — RU_4
Model |
MAE (m) ↓ |
vs lidar GT |
|---|---|---|
CHM v.2026-08-31 |
2.73 |
best |
CHM v.2026-07-03 |
8.06 |
−5.33 m worse |
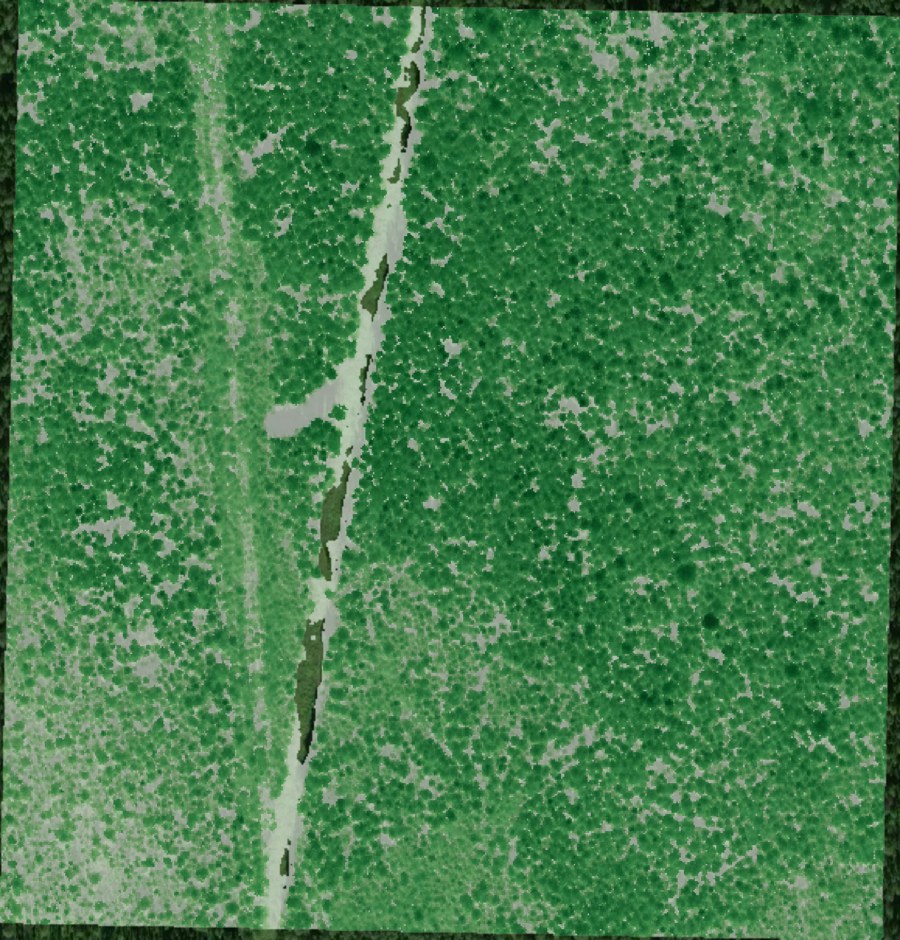
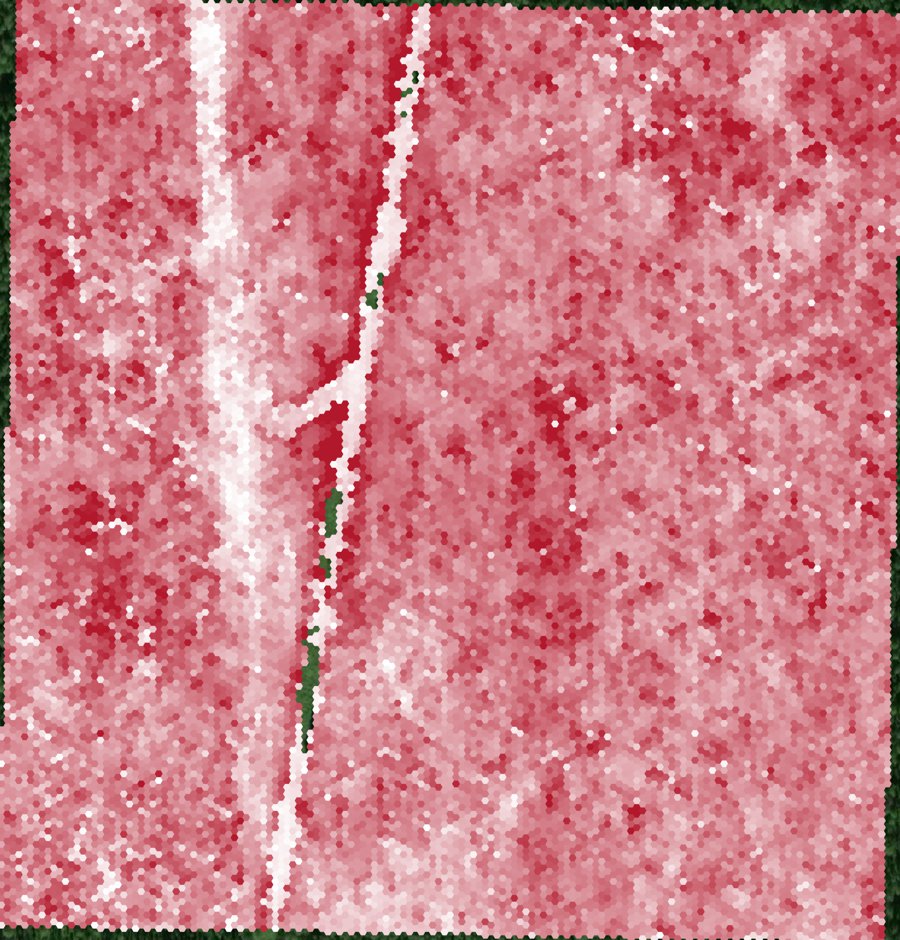
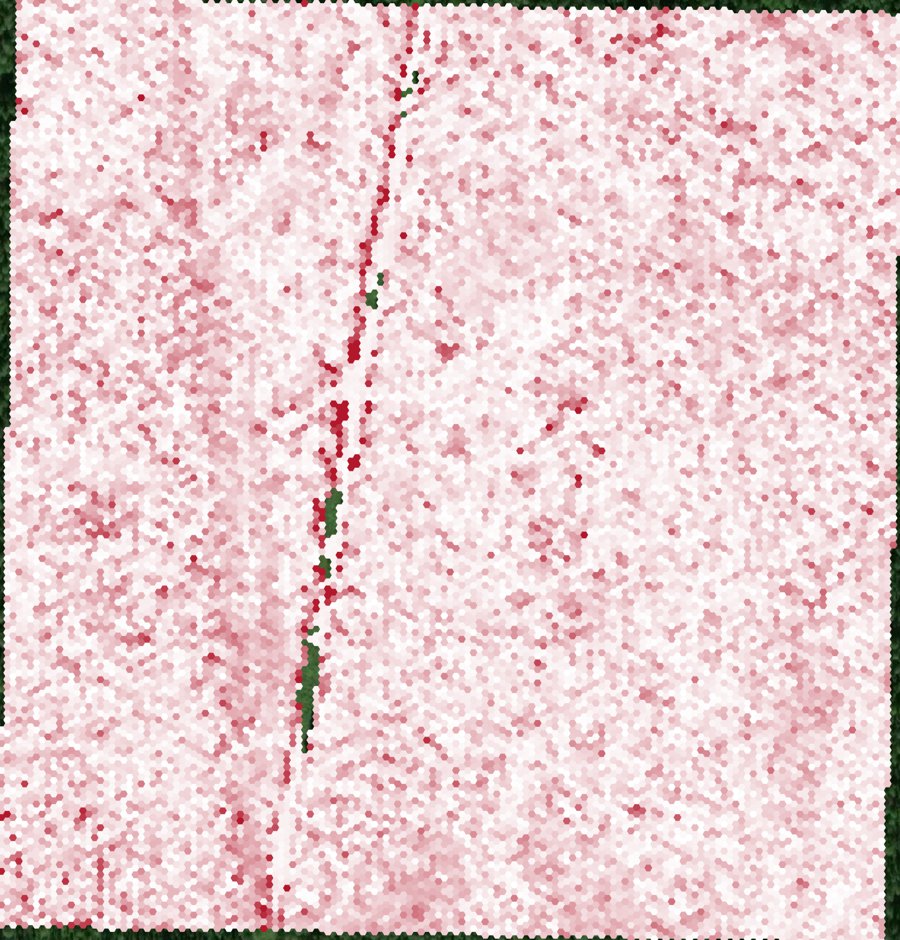
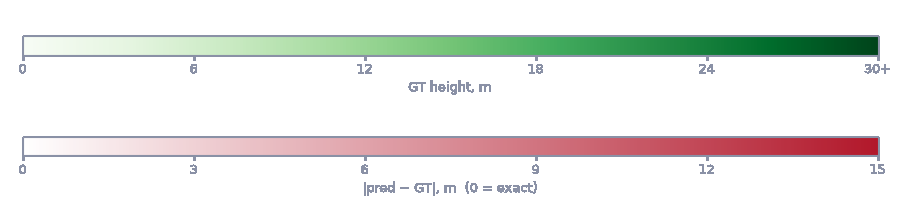
20,980 ground-truth hexagons. Mean absolute height error reduced by 5.33 m (−66%).
🇨🇭 Switzerland — SWISS_3
Model |
MAE (m) ↓ |
vs lidar GT |
|---|---|---|
CHM v.2026-08-31 |
3.36 |
best |
CHM v.2026-07-03 |
7.78 |
−4.42 m worse |
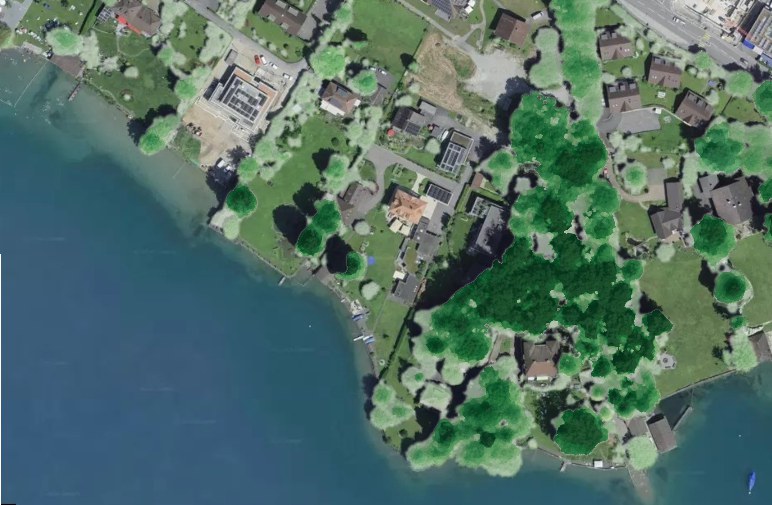
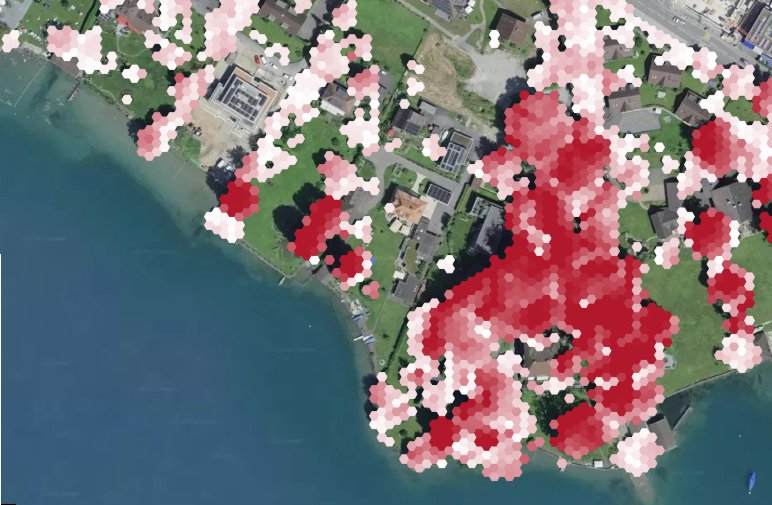
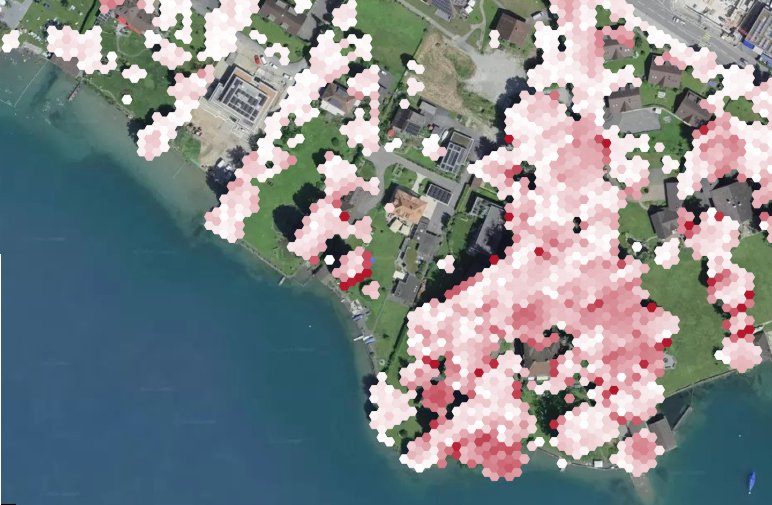
1,740 ground-truth hexagons. Mean absolute height error reduced by 4.42 m (−57%).
🇪🇪 Estonia — EST_473628
Model |
MAE (m) ↓ |
vs lidar GT |
|---|---|---|
CHM v.2026-08-31 |
2.75 |
best |
CHM v.2026-07-03 |
5.42 |
−2.67 m worse |
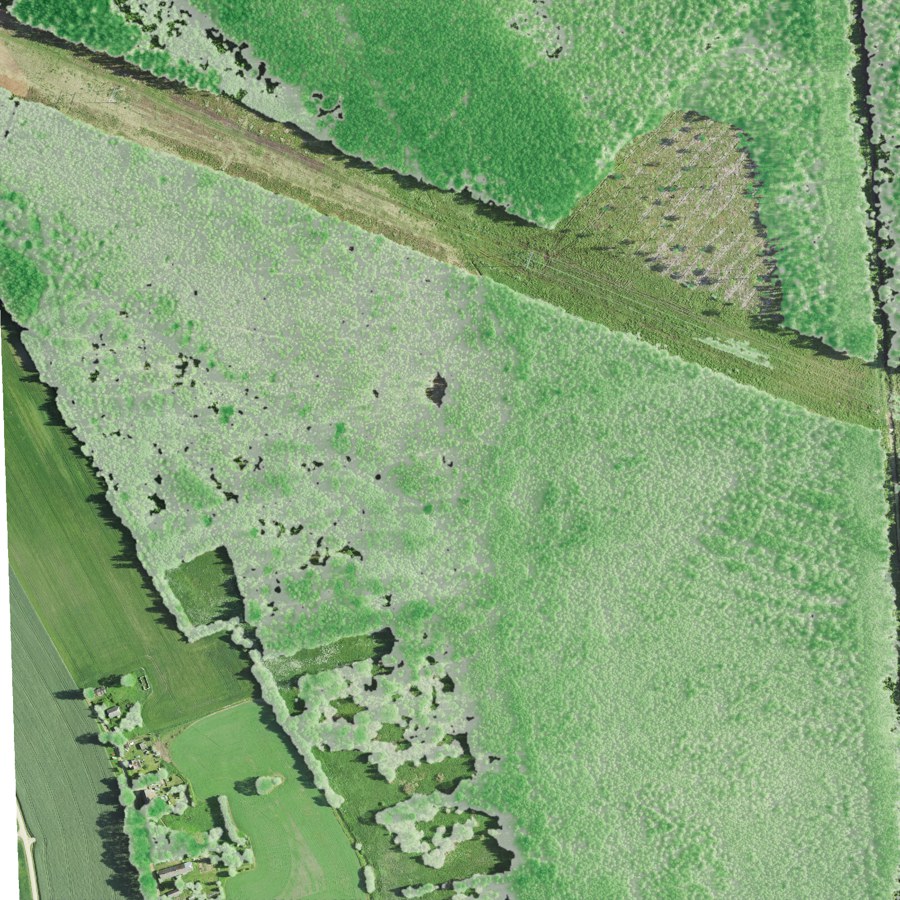
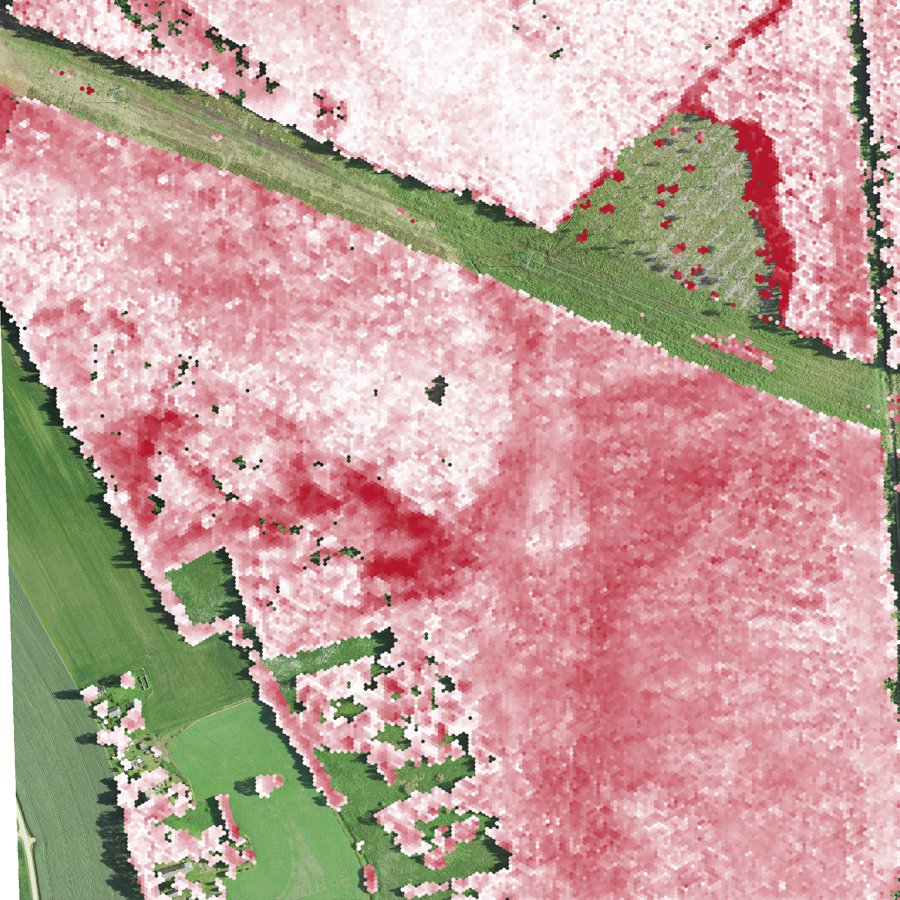
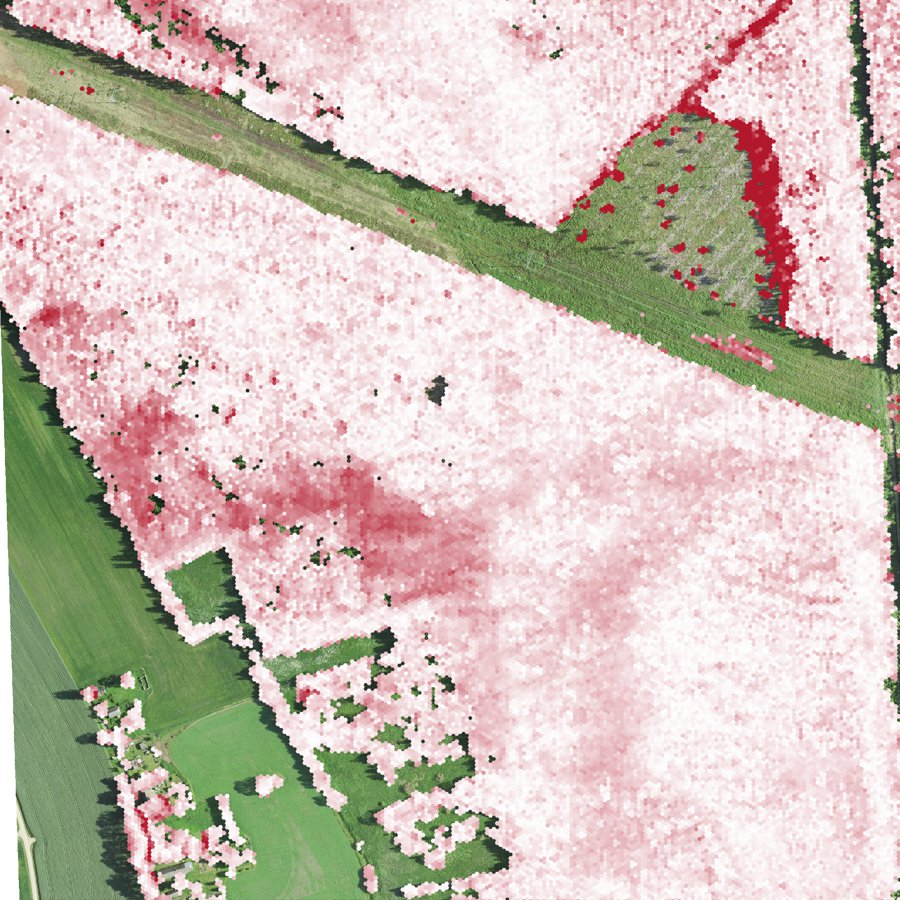
44,641 ground-truth hexagons. Mean absolute height error reduced by 2.67 m (−49%).
🇲🇽 Mexico — MEX_4
Model |
MAE (m) ↓ |
vs lidar GT |
|---|---|---|
CHM v.2026-08-31 |
1.69 |
best |
CHM v.2026-07-03 |
2.93 |
−1.24 m worse |
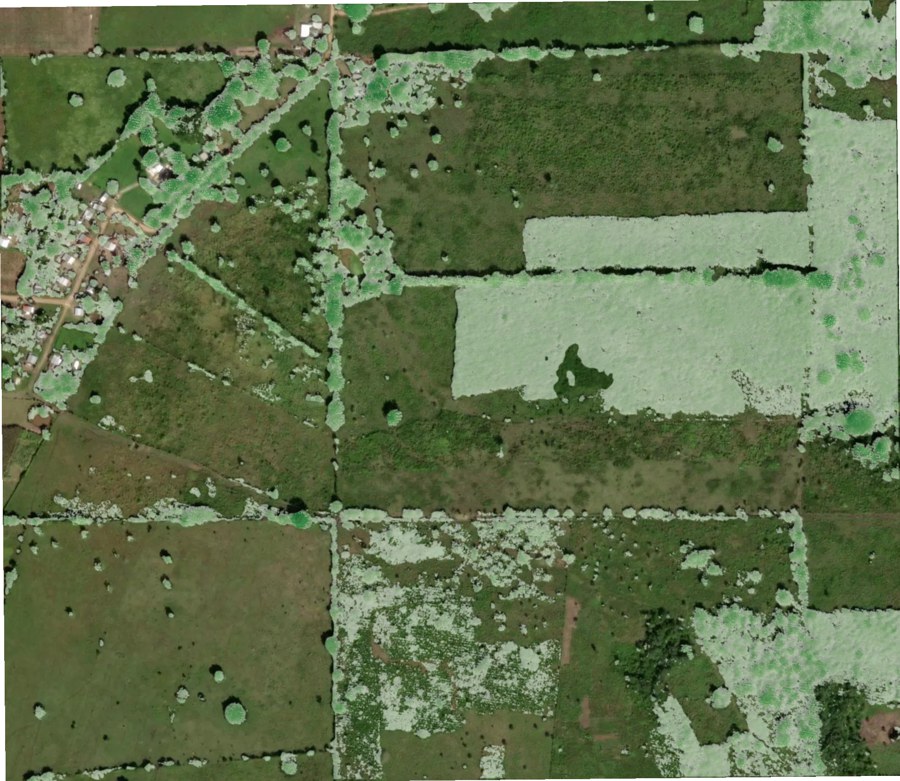
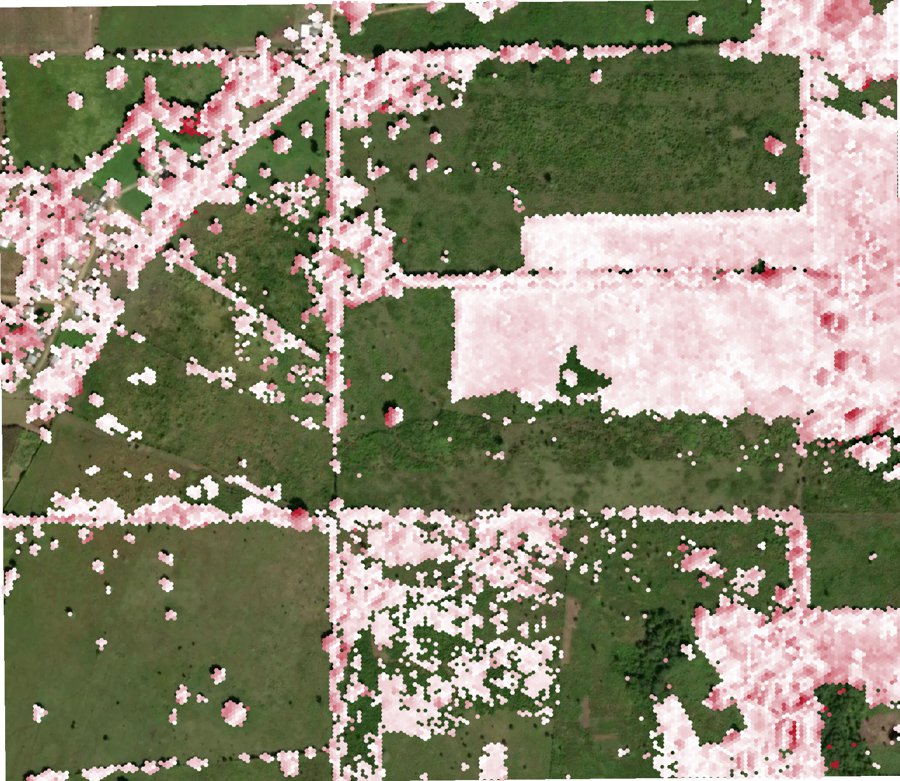
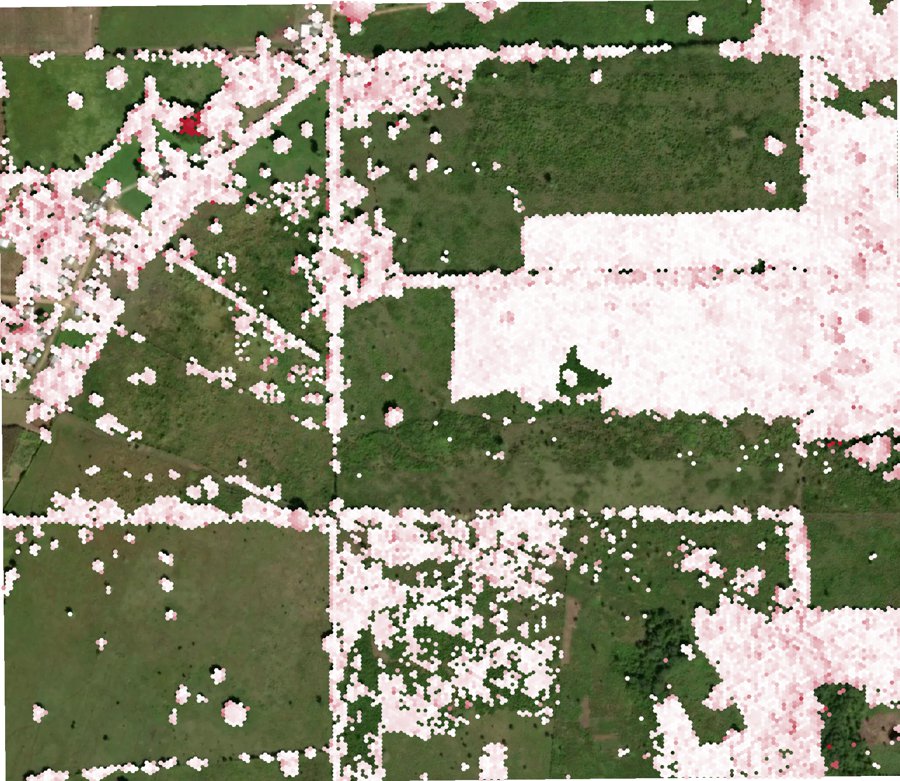
18,248 ground-truth hexagons. Mean absolute height error reduced by 1.24 m (−42%).
🇩🇰 Denmark — DEN_5
Model |
MAE (m) ↓ |
vs lidar GT |
|---|---|---|
CHM v.2026-08-31 |
2.20 |
best |
CHM v.2026-07-03 |
2.67 |
−0.47 m worse |
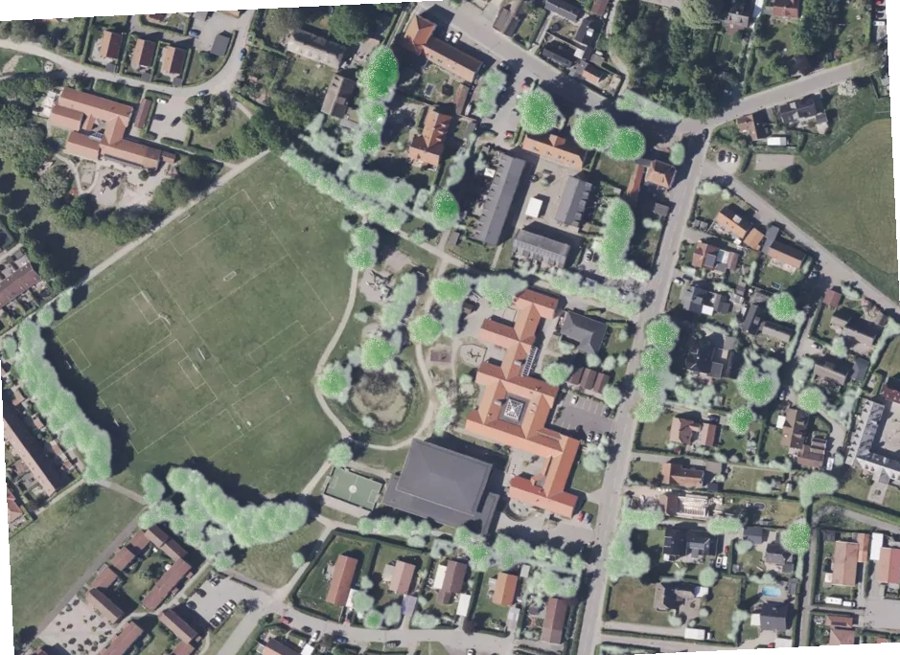
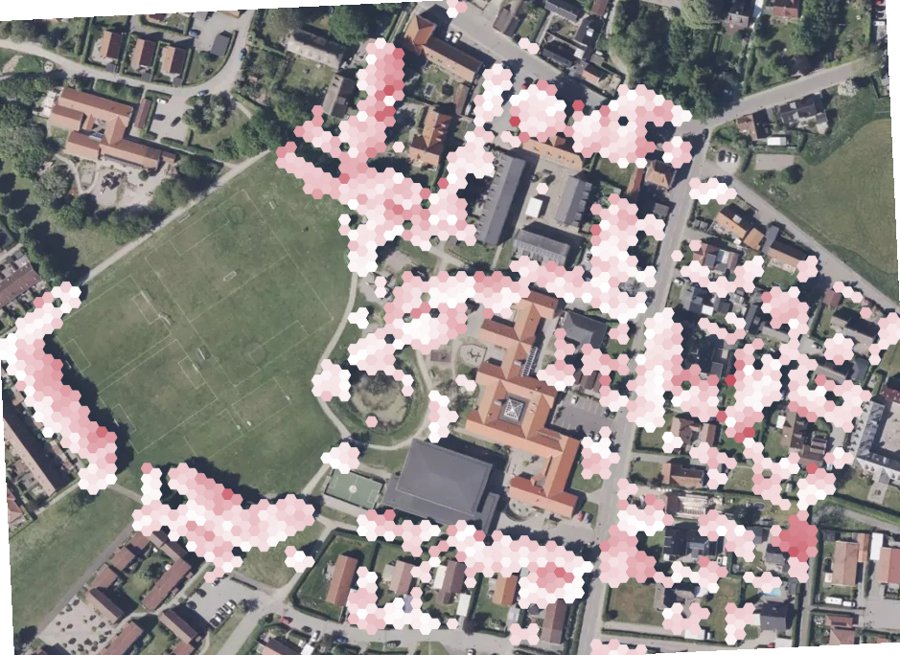
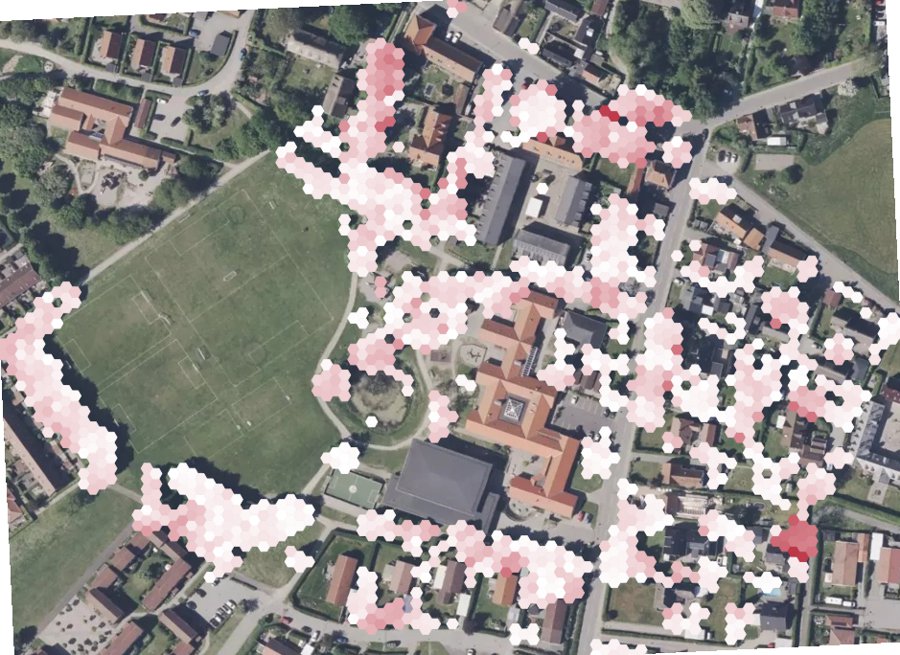
1,289 ground-truth hexagons. Mean absolute height error reduced by 0.47 m (−18%).
Summary
Country |
Sample |
CHM v.2026-07-03 MAE |
CHM v.2026-08-31 MAE |
Improvement |
|---|---|---|---|---|
🇷🇺 Russia |
RU_4 |
8.06 |
2.73 |
−66% |
🇨🇭 Switzerland |
SWISS_3 |
7.78 |
3.36 |
−57% |
🇪🇪 Estonia |
EST_473628 |
5.42 |
2.75 |
−49% |
🇲🇽 Mexico |
MEX_4 |
2.93 |
1.69 |
−42% |
🇩🇰 Denmark |
DEN_5 |
2.67 |
2.20 |
−18% |
Mean absolute canopy-height error vs lidar ground truth · 5 m hexagons, max aggregation · absolute-error ramp 0–15 m. The US sample is omitted (a single, highly generalised tile).