Mapflow - Get started
Go to Mapflow and register or login using your email. You can also use Google account to login. Mapflow processes imagery and extracts vector objects from it. So as a user, you start processing runs, or as we would call it, AI-mapping.
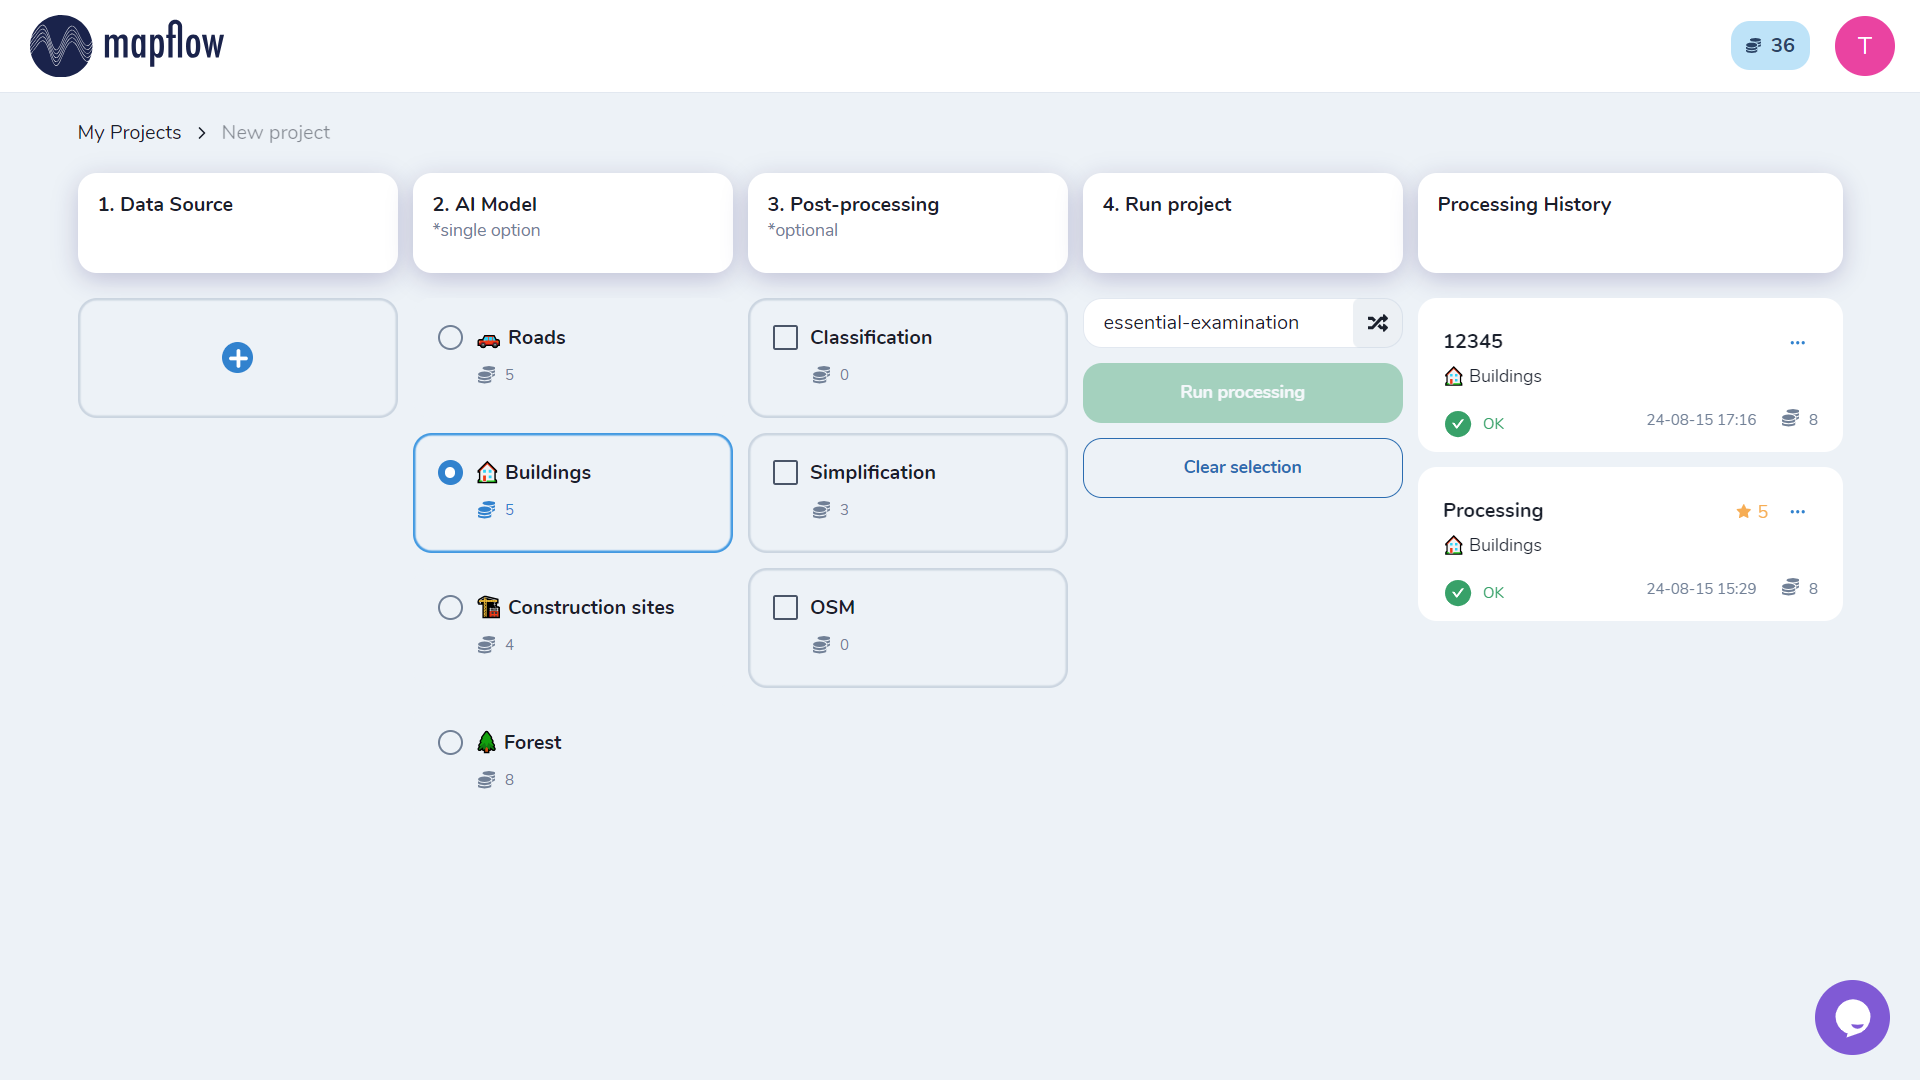
Upon the registration, the Default project will be created automatically and you will be redirected to the main dashboard:
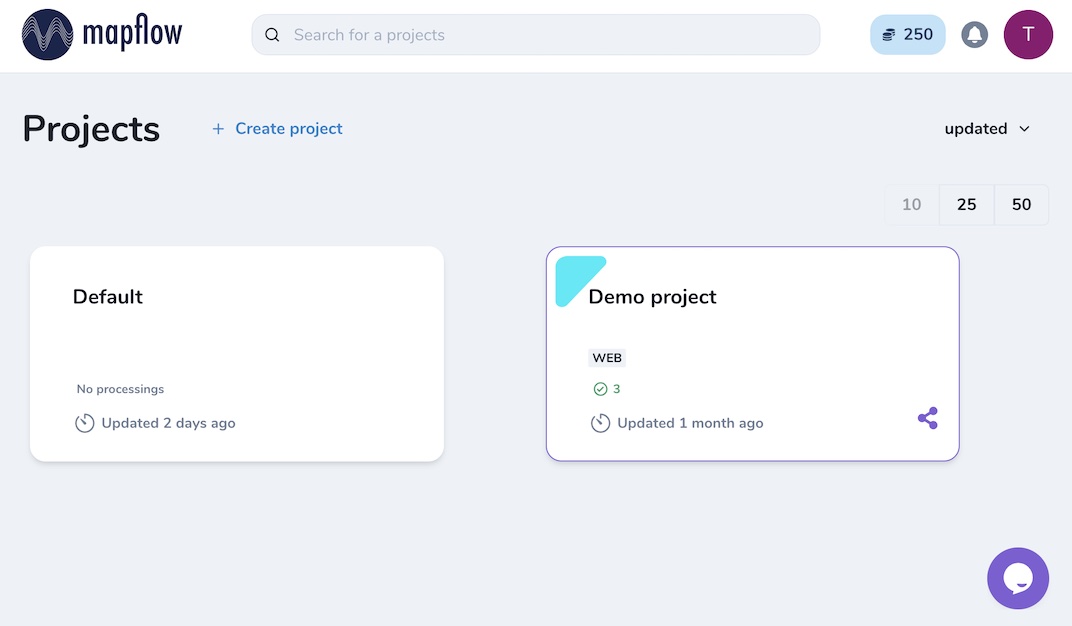
You can create as many projects as you want to organise your work and share the project access with your coworkers.
Note
See about the Mapflow Team accounts to collaborate with other users. 👈
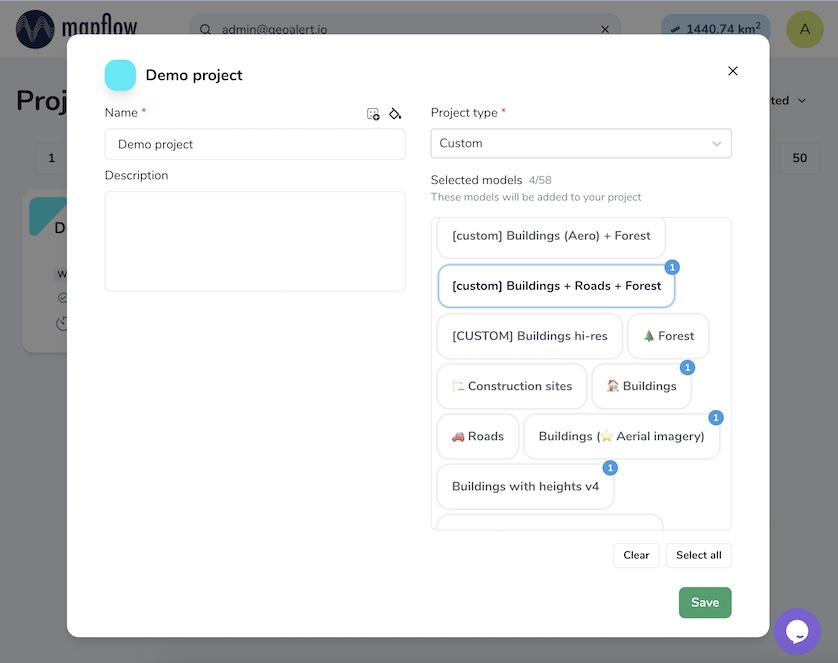
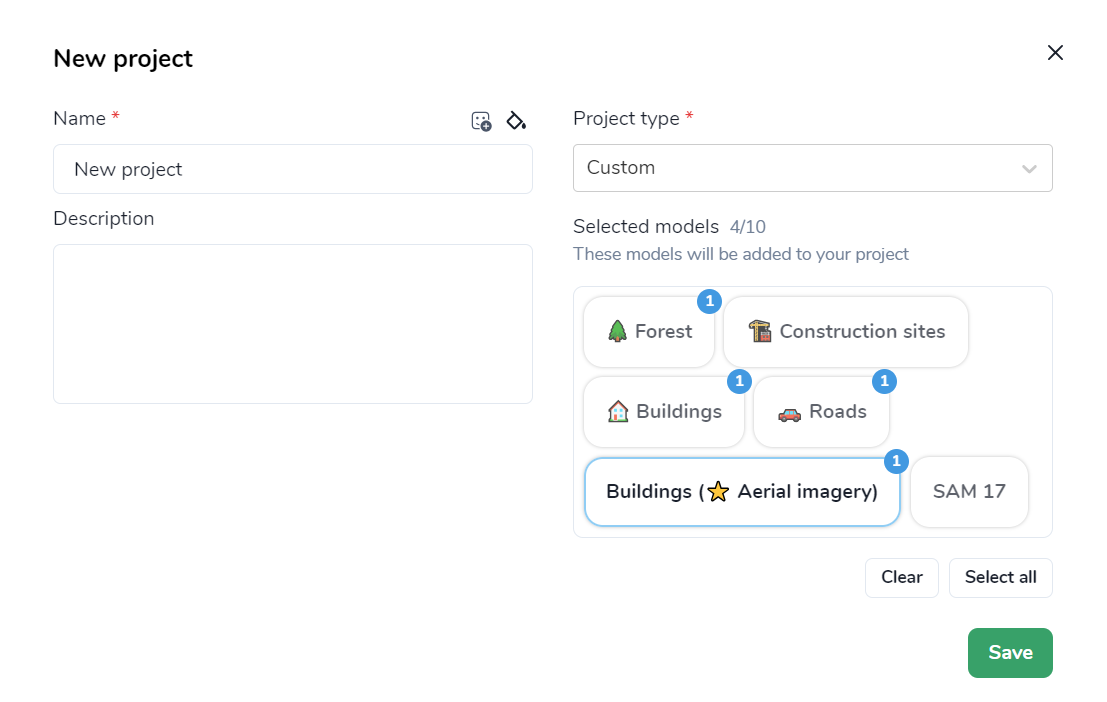
When starting a new project, you can set a name, customize icons, and modify a list of available AI-mapping workflows that are enabled in your project.
Note
If your account is upgraded to the Premium or Custom – you might be able to customize your project mapping workflows and some of their options.
Glossary of terms
Processing – a single execution of an AI model on a specific geographic area
Workflow/Flow – the AI model configuration pipeline definition
Project – space for multiple processing runs
Mapflow My account
This section contains tabs for user account settings and services.
The following services are available here:
1. User info
Fill in the user profile details
Set up your preferred language from the available
Enable email notifications (about the processing status, etc.)
2. Balance
Top up your Mapflow account with Mapflow credits.
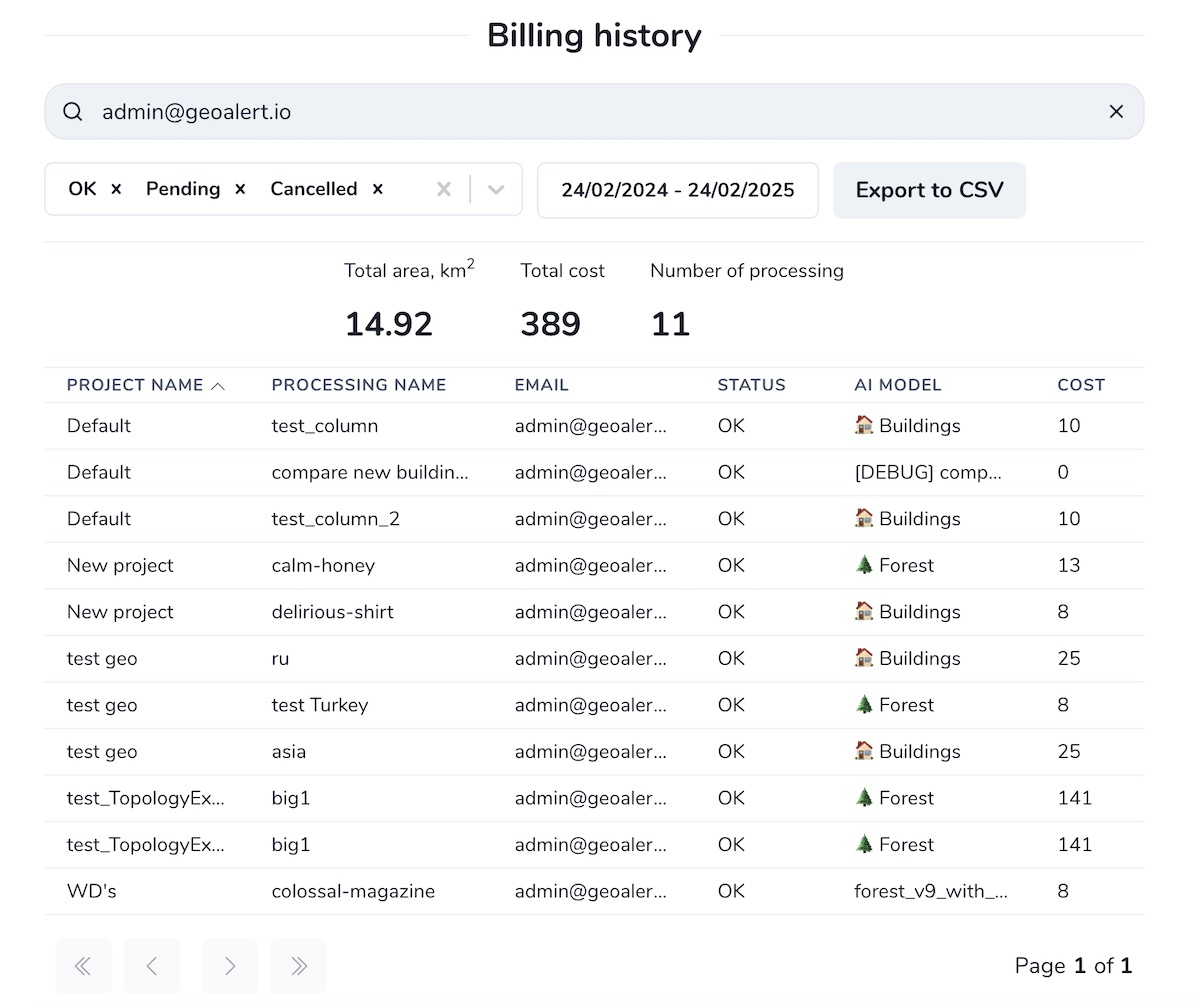
3. Billing history
Here you can see your processing history with the details. If you are a Team account owner, you can search through the history of the entire team processing runs. Use filters to sort by date and processing status. To filter by the custom parameters like user email or processing name - start typing in the search input.
Note
You can export billing history as CSV.
4. Team
Create and manage your Team accounts.
5. My Imagery
Manage your imagery collections that you can currently use in the Mapflow QGIS plugin.
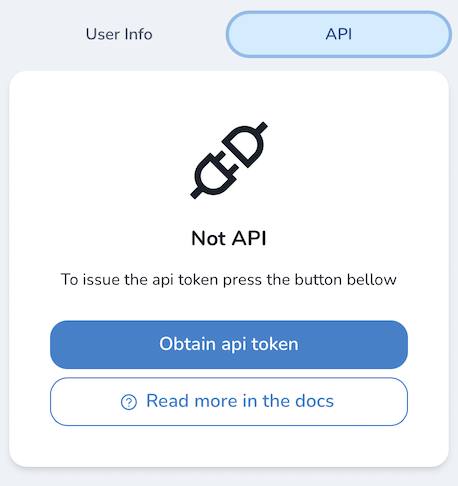
6. API
Obtain or reset your Mapflow API token.
How to run your AI mapping workflow in Web app
Mapflow is designed to be intuitive. Here is our step-by-step user guide:
1. Create a project
You can use the Default project created upon registration or create a new one. To create a new project, click the “Create project” button and fill in the project name and description.
Note
You can manage a set of models linked to a project (click the  button on the project card):
2. Specify the AOI (Area Of Interest)
First step is to set the area of analysis for your project: by AOI polygon or by the extent of your GeoTIFF image.
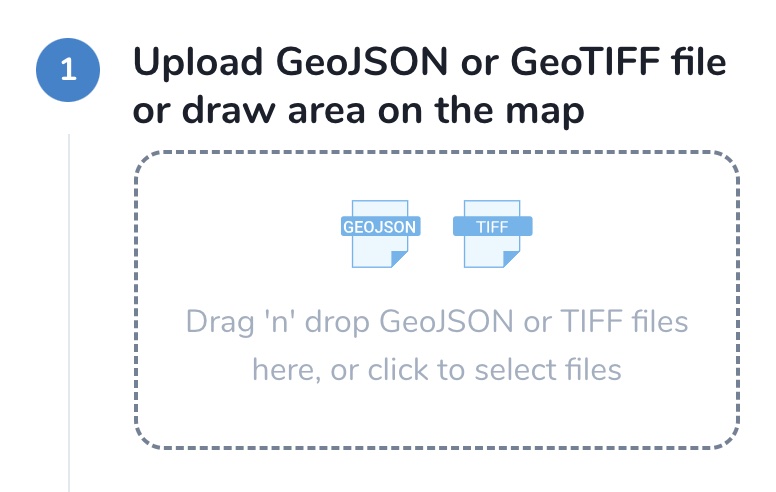
2.1. Select AOI
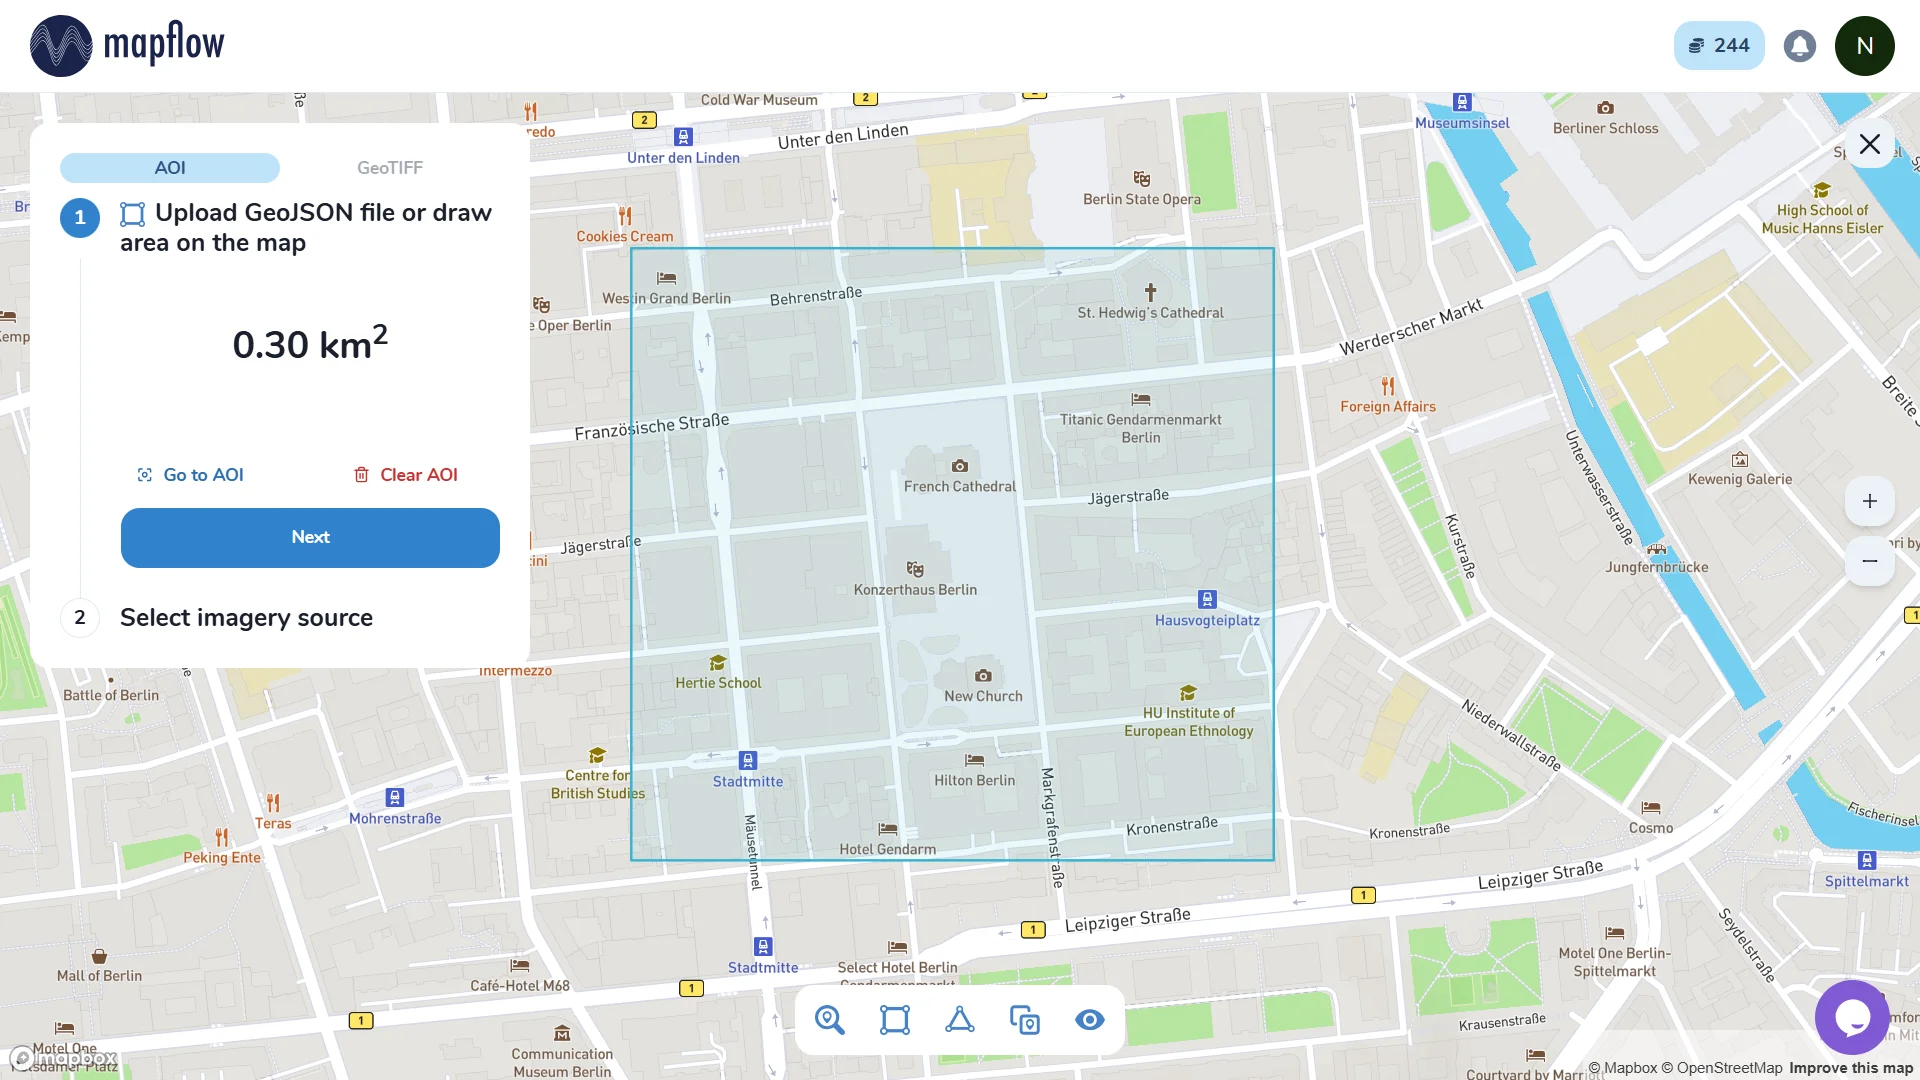
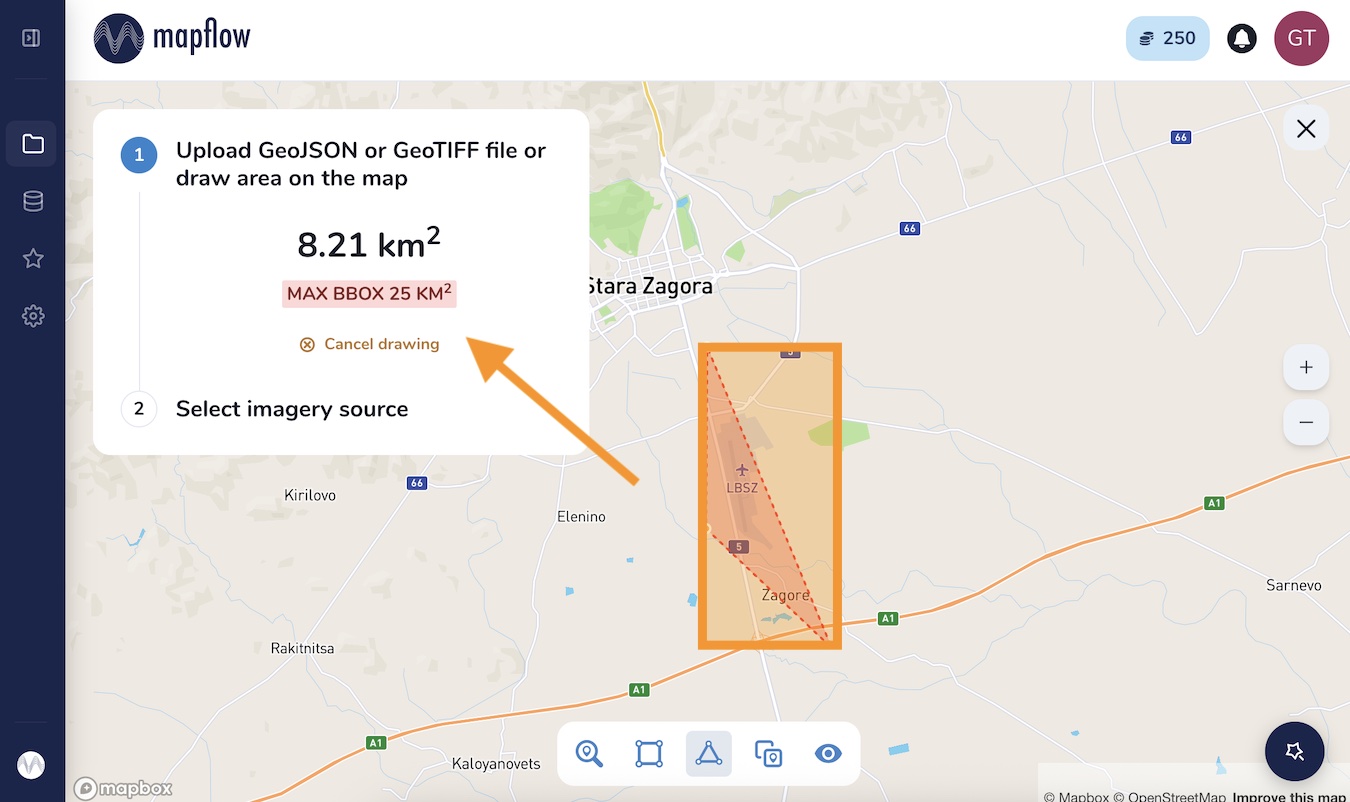
The user can draw the area using Draw rectangle / Draw polygon tool or upload it in GeoJSON format (draw and upload, as well as view the data structure, follow this link - geojson.io).
Warning
Note that max limit of total area is 25 km² for the free plan. The area limit is calculated not by the polygon, but by the Bounding Box (Bbox). Therefore, in this example a warning MAX BBOX 25 KM² appears in the example below (bounding box is highlighted):
If you want to extend your AOI limit, switch to the paid plan.
2.2 Upload GeoTIFF
You can upload your aerial images in GeoTiff format. After the image is uploaded, you need to draw/upload an AOI or click “Use Image Extent”.
Warning
Currently, a preview of the uploaded image is not possible before the processing, you will see only the area of its extent.
The processing AOI must be located in the area of this extent, otherwise the area will be cut off by the extent boundaries. The processing area is calculated by the intersection of the image extent and the AOI. If the AOI doesn’t intersect the image boundaries the error will pop up.
Note
- Image upload requirements (free plan):
The file size must be less than 1 Gb
Both sides image dimensions must not exceed 65535x65535 pixels
The image must be georeferenced and the CRS must be one of: - WGS84 (EPSG: 4326) - Web mercator (EPSG: 3857) - UTM (any zone)
Hint
If your image doesn’t meet the params above, we suggest to use Mapflow API / QGIS plugin which have more capabilities. There you can also use our new My Imagery & Data Providers tool for storing and processing multiple images. Mapflow supports RGB imagery and also process single-band (panchromatic) imagery, but the AI models are not tuned for such kind of data, so the quality of the result may be worse than expected.
2.3 Choose from My Imagery
Instead of uploading a new file, you can reuse images you have already uploaded. Click Choose from My Imagery to open the picker and select a previously created mosaic or a single image as the source for the processing.
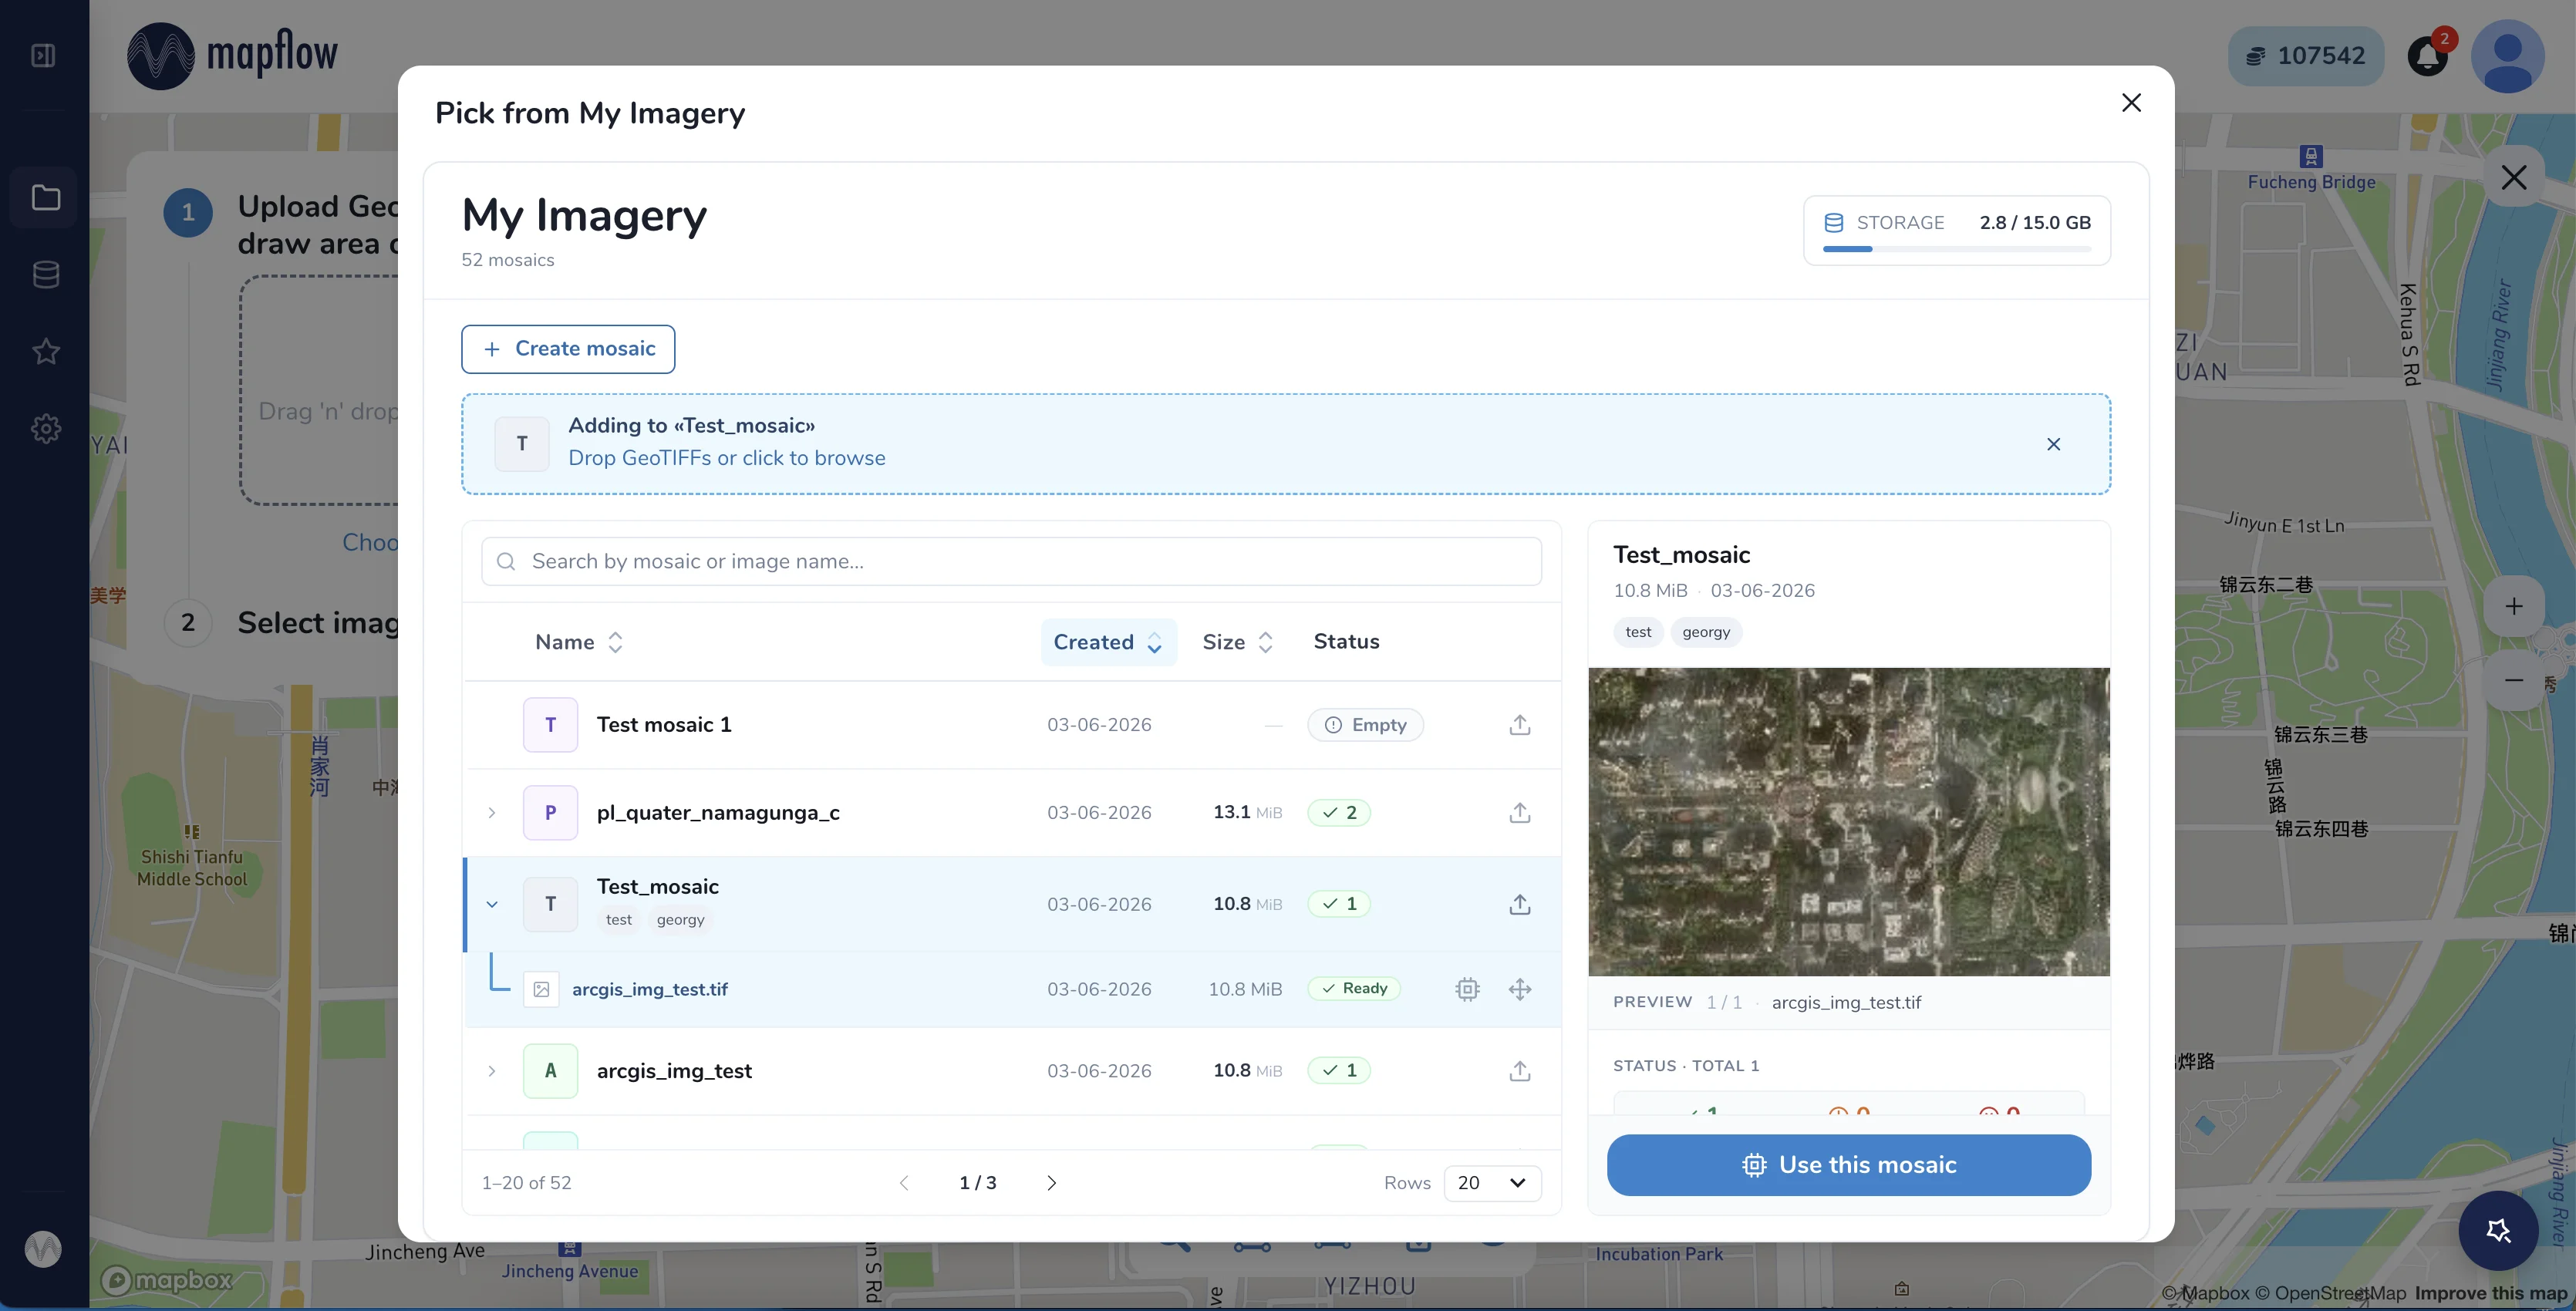
In the Pick from My Imagery dialog you can search your mosaics and images by name, sort them by creation date or size, preview the selected mosaic, and check its status. Select a mosaic and click Use this mosaic to set it as the imagery source. You can also create a new mosaic or upload images directly from this dialog.
Note
Read more about managing your uploaded imagery in My Imagery & Data Providers.
3. Select the imagery source
Note
If you uploaded GeoTIFF - the image source is already selected.
This tab allows you to select from:
Imagery providers
Custom URL
Historical data
3.1 Imagery providers
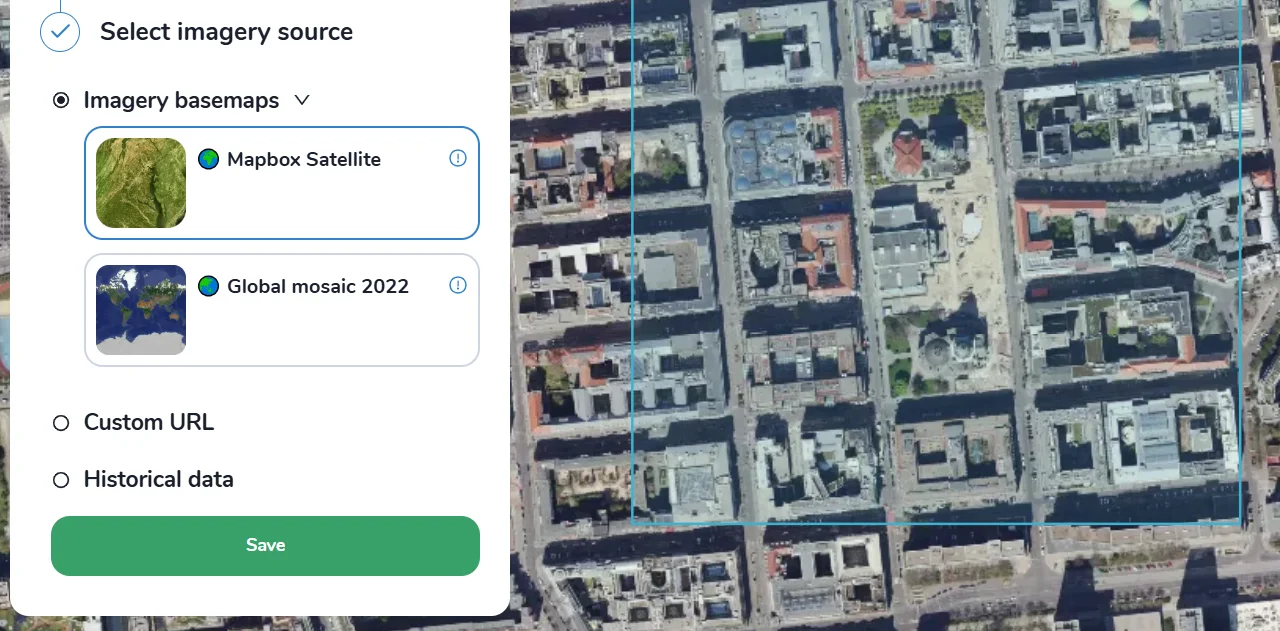
Here you can select one of the default providers that are available in Mapflow, example:
Mapbox Satellite is a provider of global high resolution satellite imagery. The date of the image and updates cannot be chosen.
“Global mosaic” is a pilot version of mosaic of high res imagery (0.75–0.5 m/px) for year 2022. The preview is limited to zoom 15. Limited coverage for some countries. The mosaic is planned to be updated on a regular basis.
ArcGIS World Imagery is a provider of the global coverage composed of high and medium resolution satellite imagery and aerial imagery, hosted by ESRI. The frequency of updating images is 1-5 years depending on the territory.
Hint
You can search the ArcGIS World Imagery metadata (date, zoom level) by location. To do this, use the Mapflow Imagery search tool in QGIS.
Important
Data providers are the TMS / XYZ data streaming services that can be connected to Mapflow to enable instant imagery analysis and AI mapping. Under the Mapflow commercial plans, we provide commercial providers access, historical imagery and updates on specific terms. We are continuously working on adding more commercial providers. For more details about the Imagery providers cost, see Mapflow subscription plans.
3.2 Custom URL
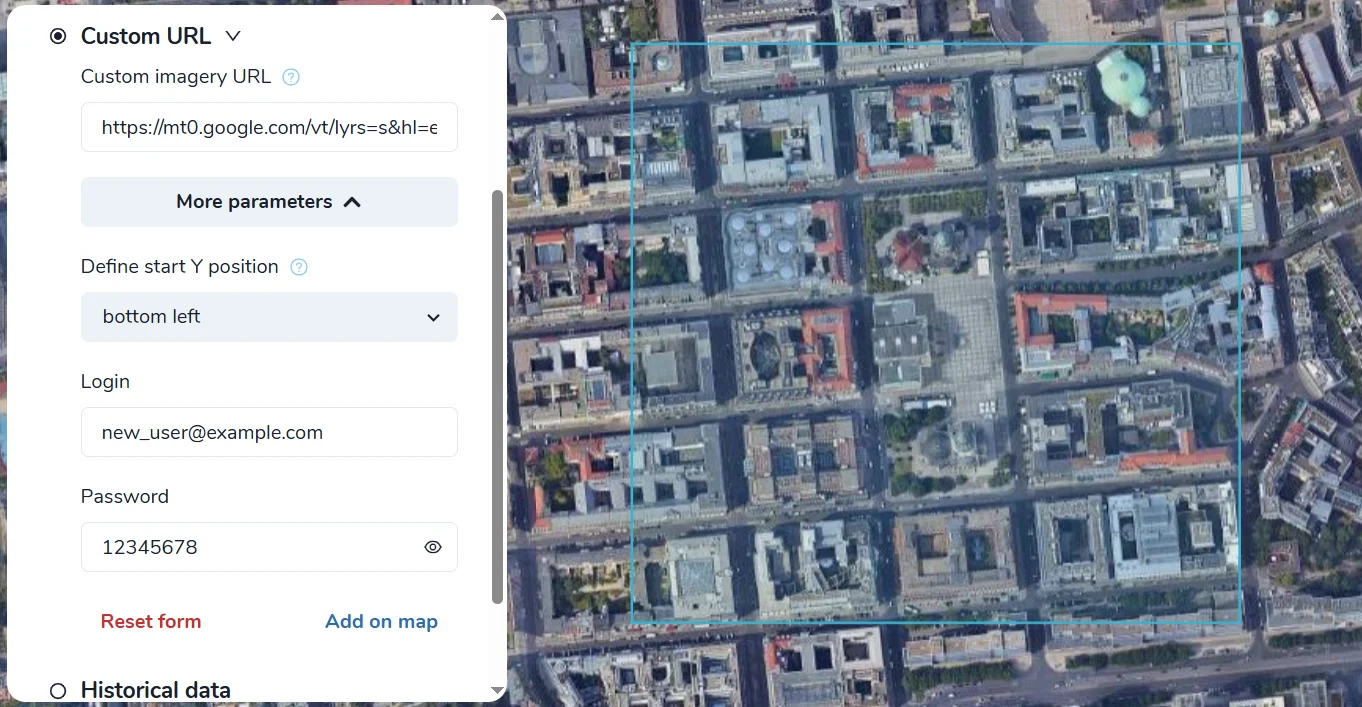
Specify the XYZ link to the source of the images. The link is automatically checked for validity (for example, Openaerialmap -
https://apps.kontur.io/raster-tiler/oam/mosaic/{z}/{x}/{y}.png);When adding you custom tile service it might be needed to define Y position: XYZ (top left), TMS/WMTS (bottom left);
Provide your authorization data for the desired source (Login + Password);
Add on map to preview.
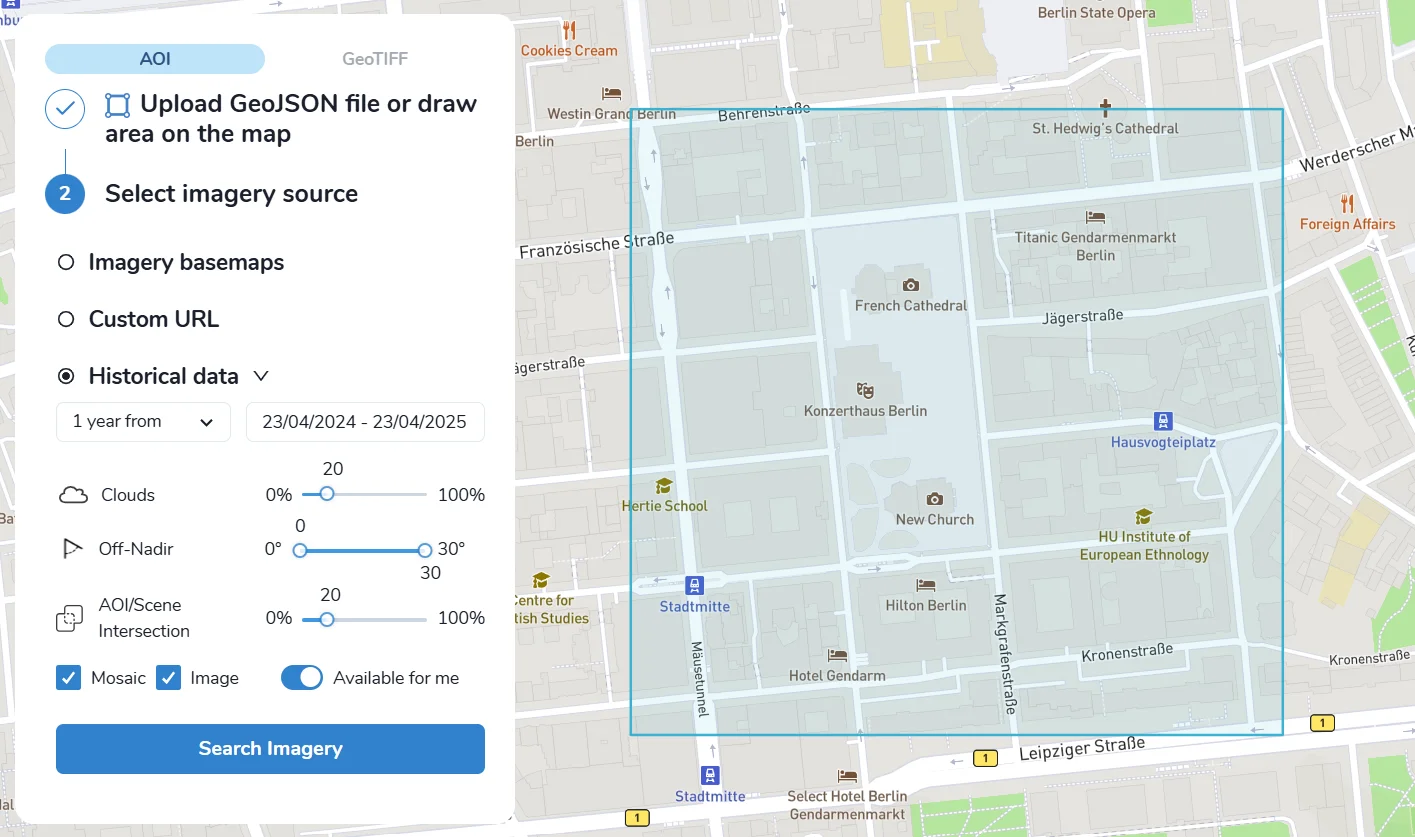
3.3 Historical data (Imagery Search)
“Imagery search” allows Mapflow users to search for available satellite imagery over their area of analysis. It’s powered by Mapflow API providing access to the global satellite data providers through our partners.
4. AI model
Select one of the AI models (see Model description).
If your data source is Data provider (Imagery basemap), after selecting the model, the recommended zoom level for it will be set automatically. Note that you can always select any zoom level and check its availability with the “Suggest”  button.
Warning
If the recommended zoom is unavailable, you can start the processing using lower zoom level, but the result may be less accurate.

4.1. Post-processing options
In this step, you can select additional processing options. Different AI models have their own options.
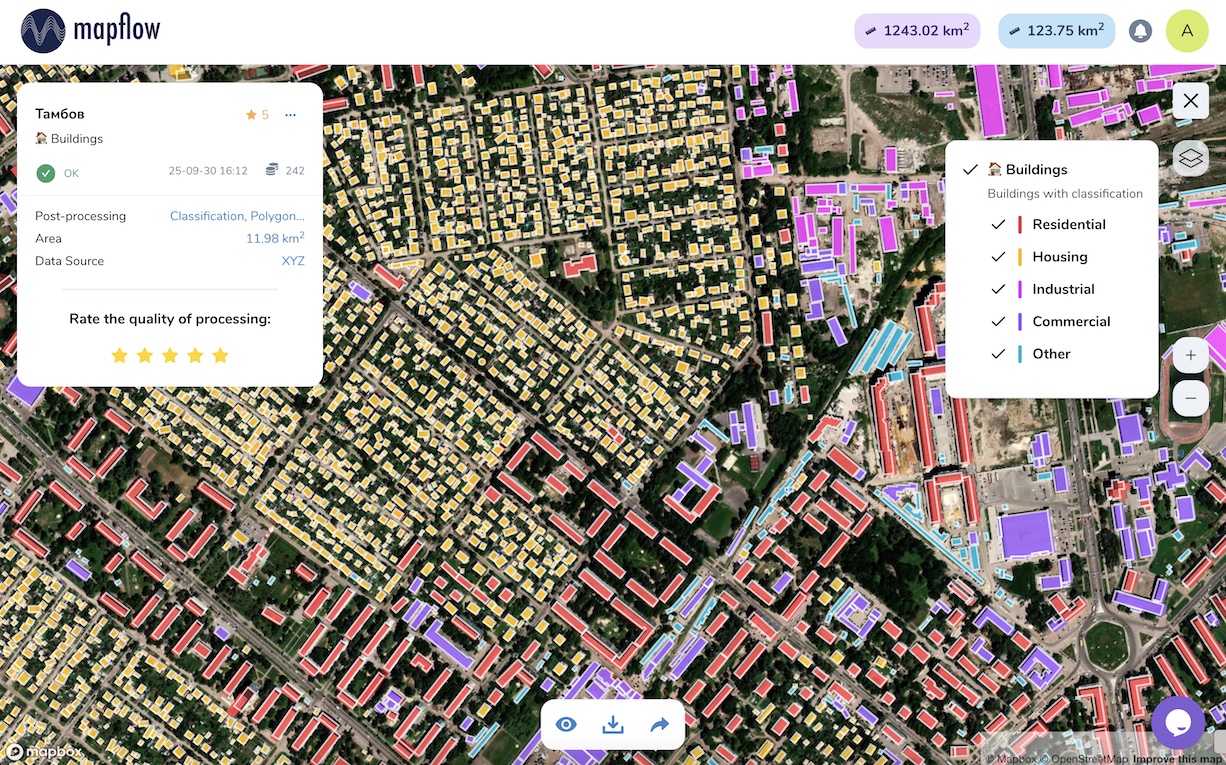
AI model “🏠 Buildings”:
Classification - we currently recognize the following building types: apartment buildings, single-household dwellings, industrial, commercial, other non-residential (see Building Mapping classes).
Merge with OSM - compare the results with the buildings in OpenStreetMap and, if a sufficient overlap has been found, use the ones from the OSM instead.
Simplification - simplification of building contours.
Regularization - regularization of building contours to make them more rectangular.
Building heights - for each building, we estimate its height. If this option is selected, all roof contours will be shifted in accordance with their height, i.e. converted to “footprints”.
AI model “🌲 Forest”:
Heights - classifies vegetation by height classes: by default 0-4 m for shrub (“low vegetation”), 4-10 m for regular forest (“medium forest”), 10+ m for area with tall trees (“high forest”). Classification is done per vegetated area, and not per single tree (see Forest Mapping classes).
Tree crowns - extracts tree crowns from dense forest cover as well as free-standing trees.
5. Run the processing
At this step, you can set the name of your processing or use the initially generated one (the button allows you to generate variants of the name).
The “Start processing” will start processing.
The “Clear Selection” will clear the previously selected processing parameters.
Attention
Once you have selected the model and the processing parameters, you will see the total cost of your processing counted in Mapflow credits. Upon registration, you receive 250 credits for free for testing the platform (See Mapflow credits).
6. View the results
In the “Processing history” you see the progress of processing as well as view and get the processing results. Each running processing displays the selected model, the status, the creation date and the processing cost.
6.1 View on the map
After the successful processing completion, the card can be opened to view more detailed information about the processing parameters - AI Model, Post-processing, Area, Data Source.
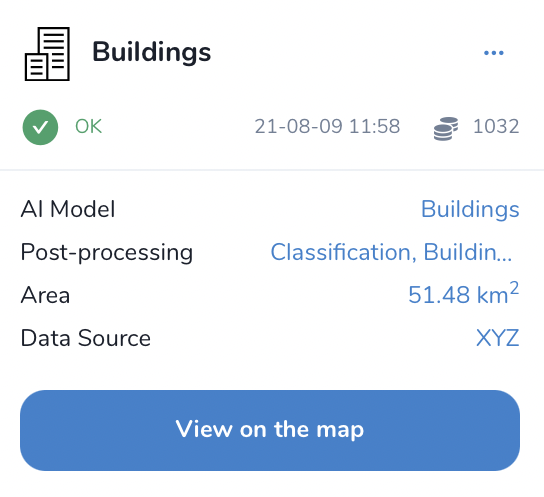
Click the “View on the Map” to quickly view the processing result on the built-in interactive map.
6.2 Feature attributes and multilayers
Depending on the model and the options applied the extracted features might contain the semantic information that is written in the feature properties in GeoJSON.
E.g. “Buildings” model with “regularization” and “classification” by building typology options:
PROPERTY |
DESCRIPTION |
|---|---|
Area |
Feature area in meters |
Class_id |
Buildings typology |
Shape_type |
The geometry primitive depending on the polygonization algorithm that’s been applied to the feature mask |
Processing_date |
The date of the processing completion |
Simplification_score |
The score is counted by the intersection of the pixel feature and polygonized feature. The higher score - the closer polygonized feature to the pixel one. |
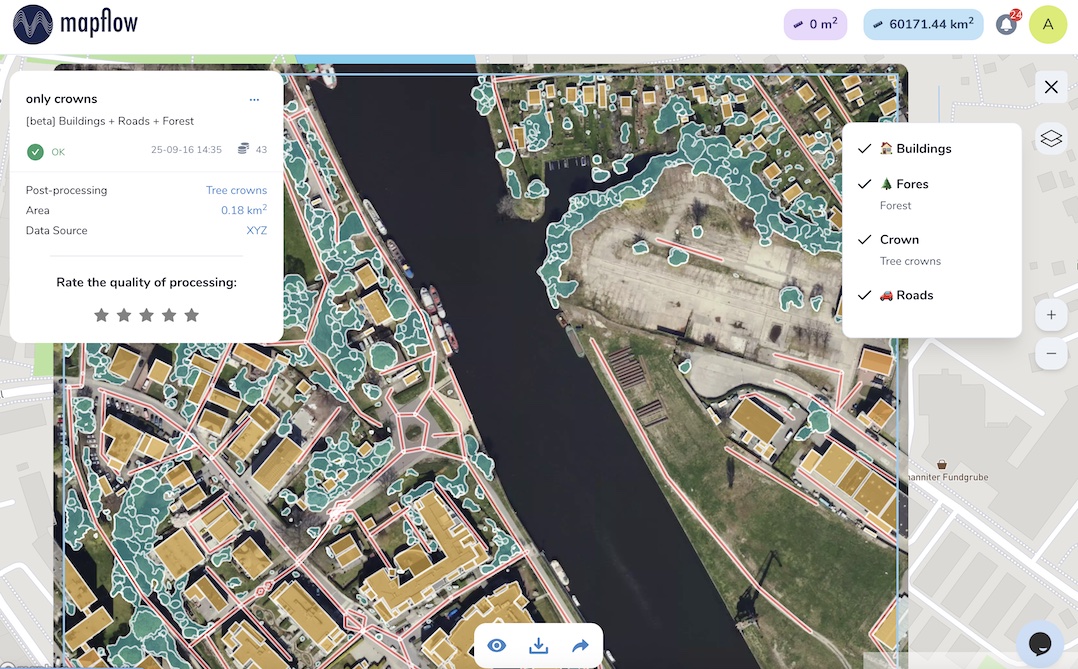
6.3 Layer Switching & Legend
You can switch the layers to preview on the map. Click the “sandwich” (☰) button on the top right corner of the map and extend the dialogue with the map legend.
E.g. “[multi] Buildings + Roads + Forest” model results with different layers:
6.4 Rate the processing
Important
- We encourage you to rate the processing results. ⭐️⭐️⭐️ Your assessment is important for further improvement of the Mapflow AI models. We review all the user’s feedback and get back to you if any issues.
6.5 Share the results
You can share your project with the external users for the view-only access. Go to the Project – Share and enter the Mapflow user’s email.

Note
To upgrade project sharing rights and provide your collaborators with the editor’s access you need to switch to the Team accounts
7. Use the processing results
The Processing menu includes the items as follows:
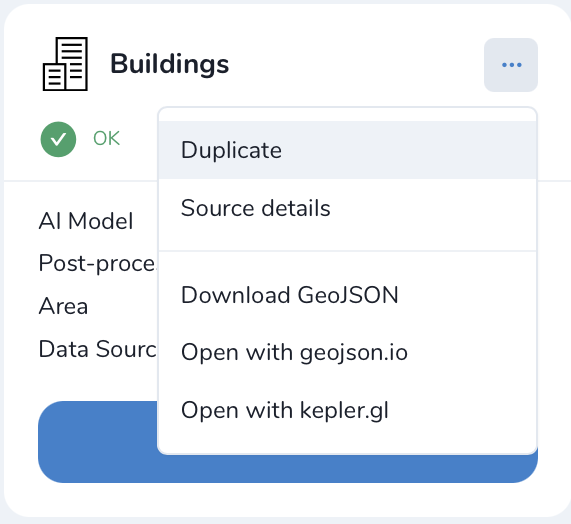
Click “Duplicate” on an existing processing to use its parameters as a starting point for a new one (on restart with the same parameters, new processing is started).
Click “Source details” on the existing processing to view information about source details and AOI.
Tip
If you want to duplicate processing to change some params, like choosing another AI mapping model for the same AOI - use Duplicate
7.1 Download GeoJSON
Allows to download results as a file in GeoJSON format.
Warning
This option is not available in the free plan. Only paying users (see pricing) can use this option.
Working with API
Mapflow provides a REST API which, for example, allows you to query for currently running flows and fetch the results. If you are developing an application and want to use our API, - check out Mapflow Processing API.
Important
You must follow the requirements specified with Model requirements when uploading your own images for processing through the API of the Mapflow platform. Send a request using data preprocessing to help@geoalert.io.