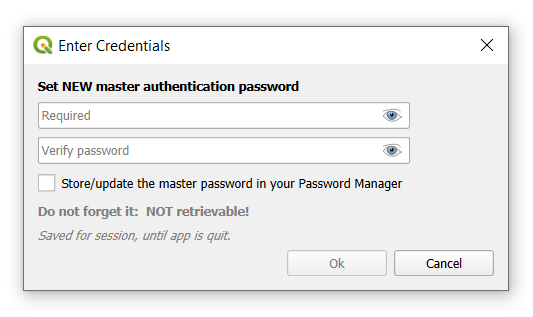
You will be prompted to set a new master authentication password - qgis feature to ensure the security of sensitive information storage.
3. ClickLoginbutton
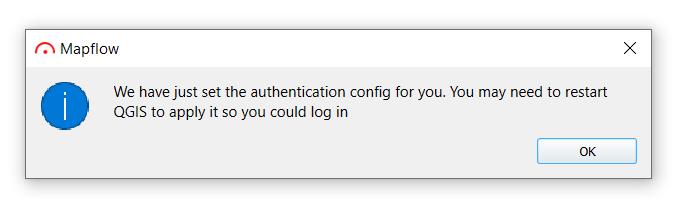
You will receive the following message, restart QGIS before the next steps.
4. After restarting QGIS, clickLogin
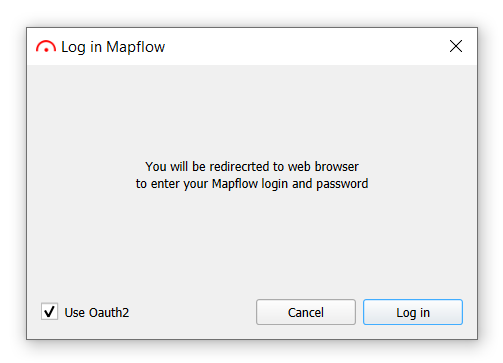
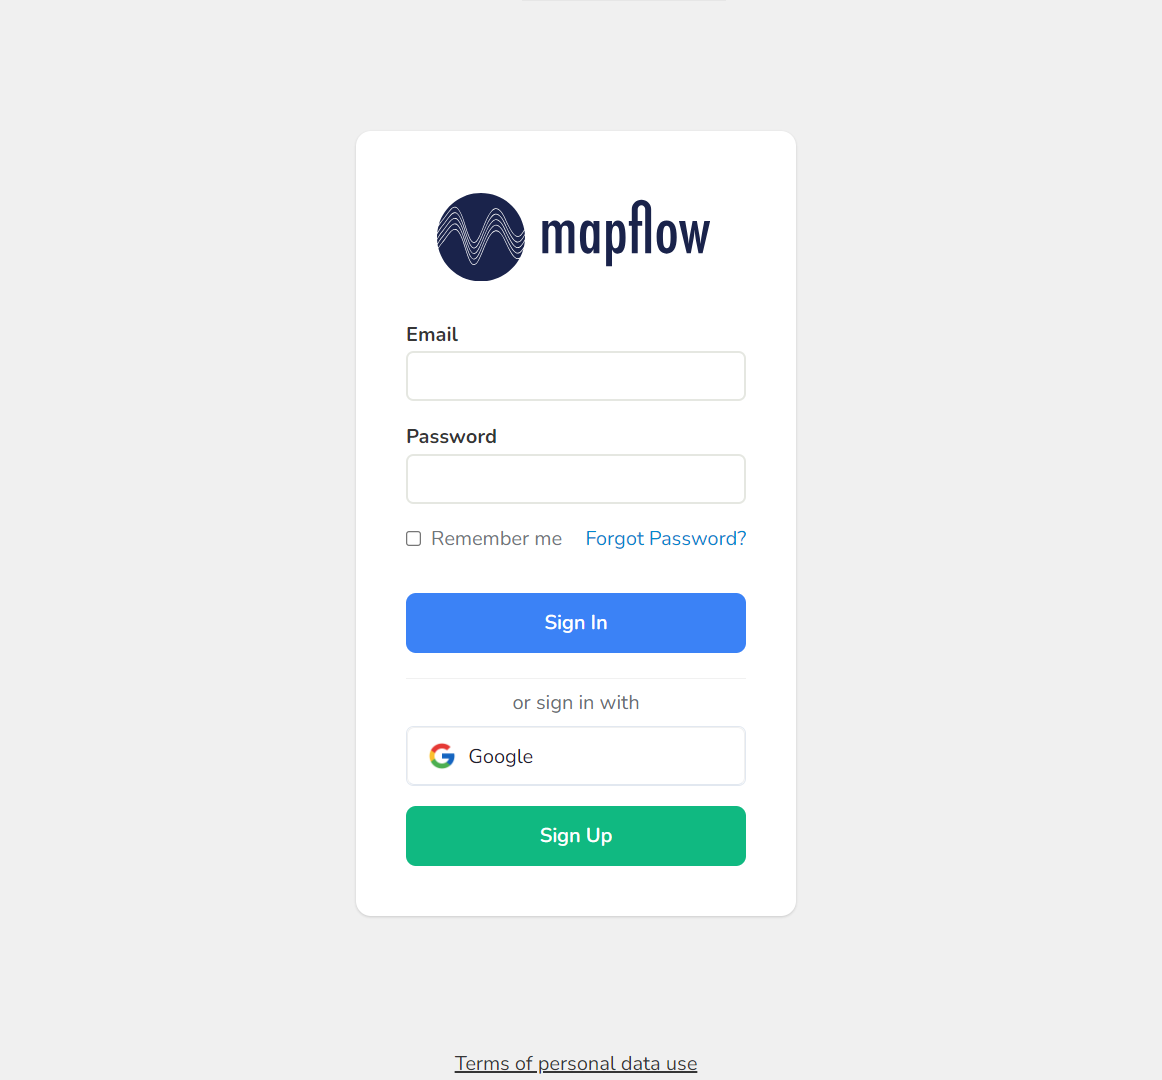
You will be redirected to the browser to log in/register in the mapflow system:
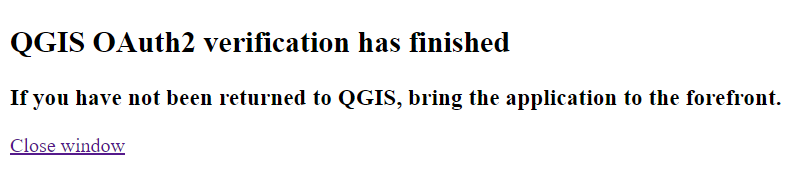
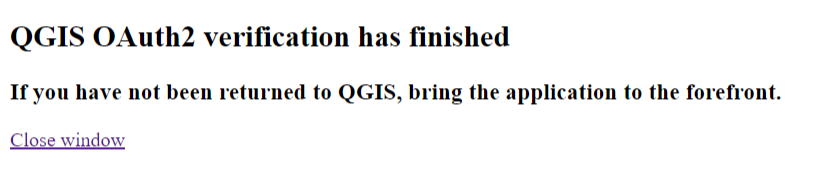
After successfully logging in, you will receive a message about the successful verification of QGIS OAuth2:
Note
You can close this page
5. Go back to QGIS
OAuth login completed!
Important
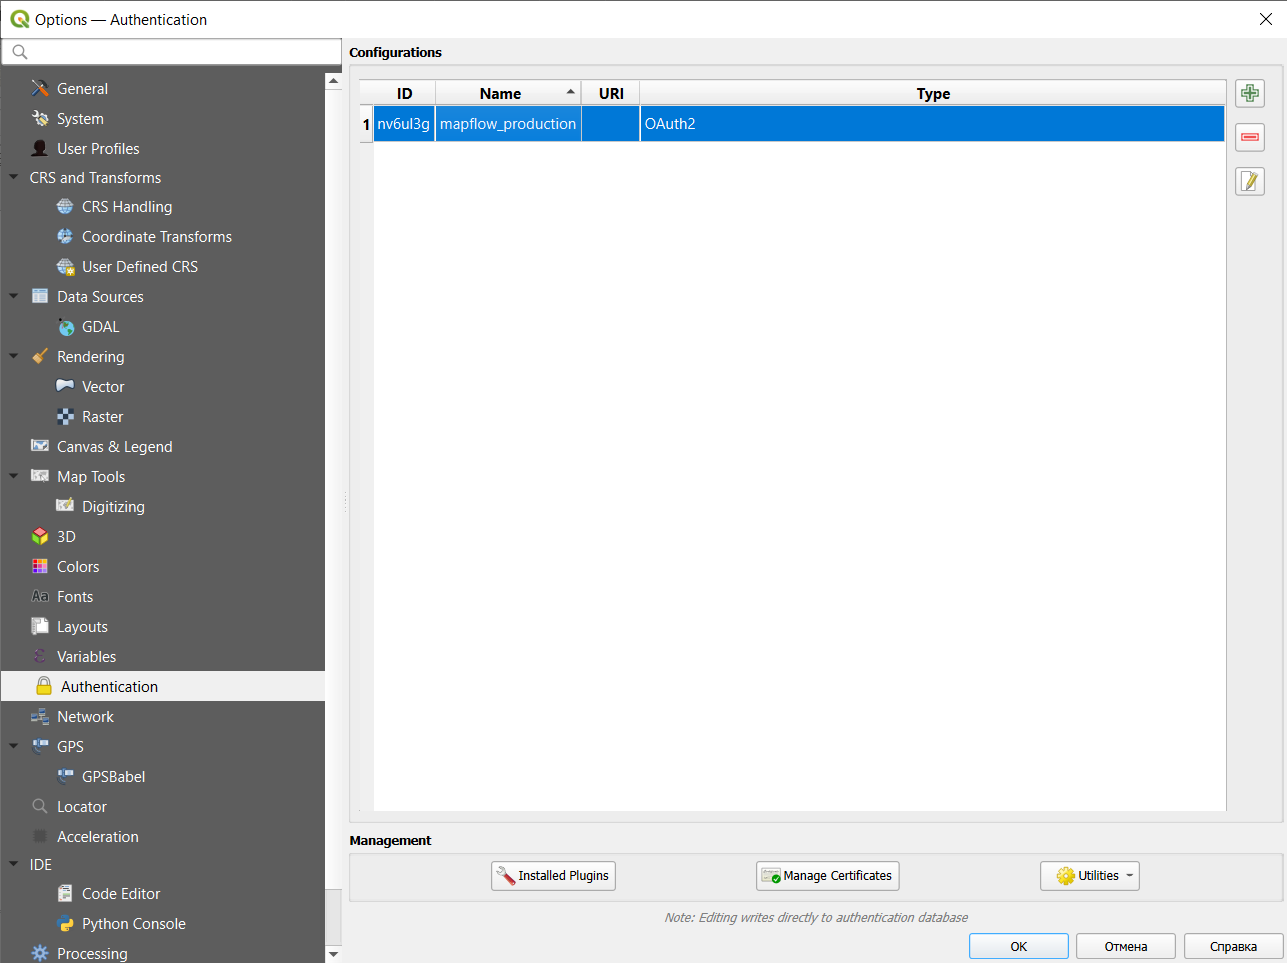
If you have problems with authorization, you can delete the current authentication config by going to Settings->Options->Authentication, select the config and remove it:
Object mapping in remote sensing images using Mapflow plugin for QGIS
Interpretation and subsequent digitization of satellite imagery is a rather laborious process. The use of AI-based image recognition technologies leads to a reduction in labor costs and an increase in data processing speed.
In the QGIS, the process of detecting objects of various types can be automated using the Mapflow plugin. To accomplish this, you can follow the steps described below.
1. Installation of Mapflow plugin and logging in
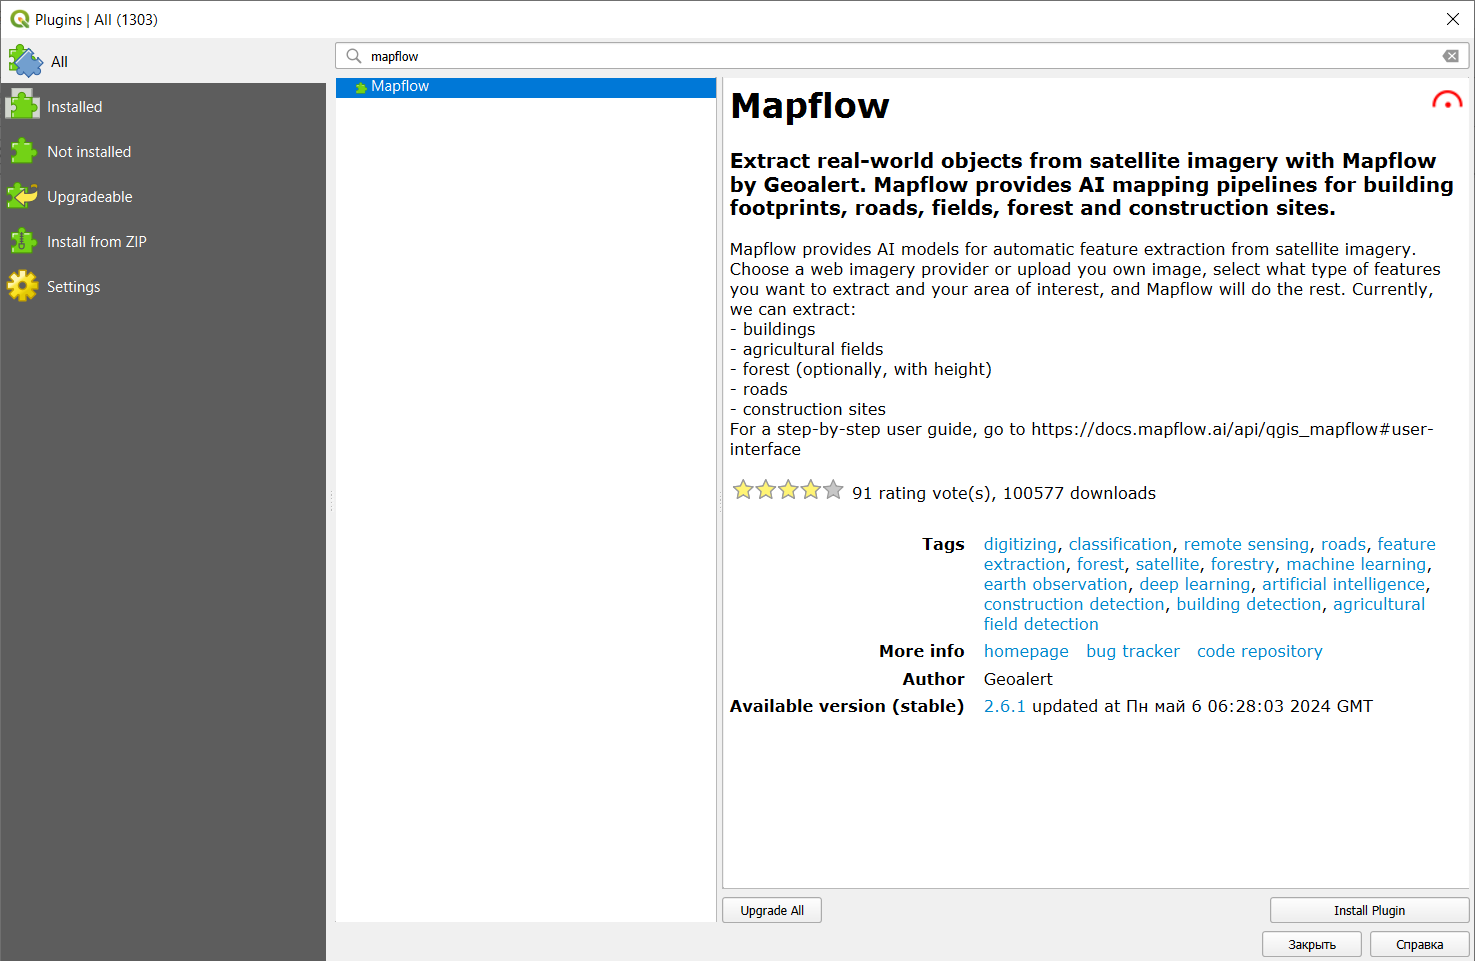
First of all, you have to install the plugin in QGIS. To do this, go to the tab called Plugins -> Manage and Install Plugins, find Mapflow using the search bar and click Install Plugin.
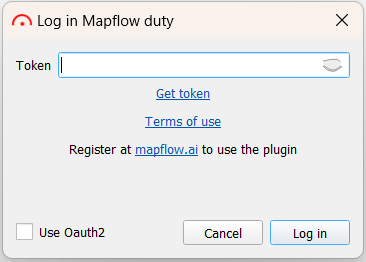
After installation, the plugin icon will appear in the toolbar: . Clicking on it will open the authorization window, in which you need to click on “Get token”.
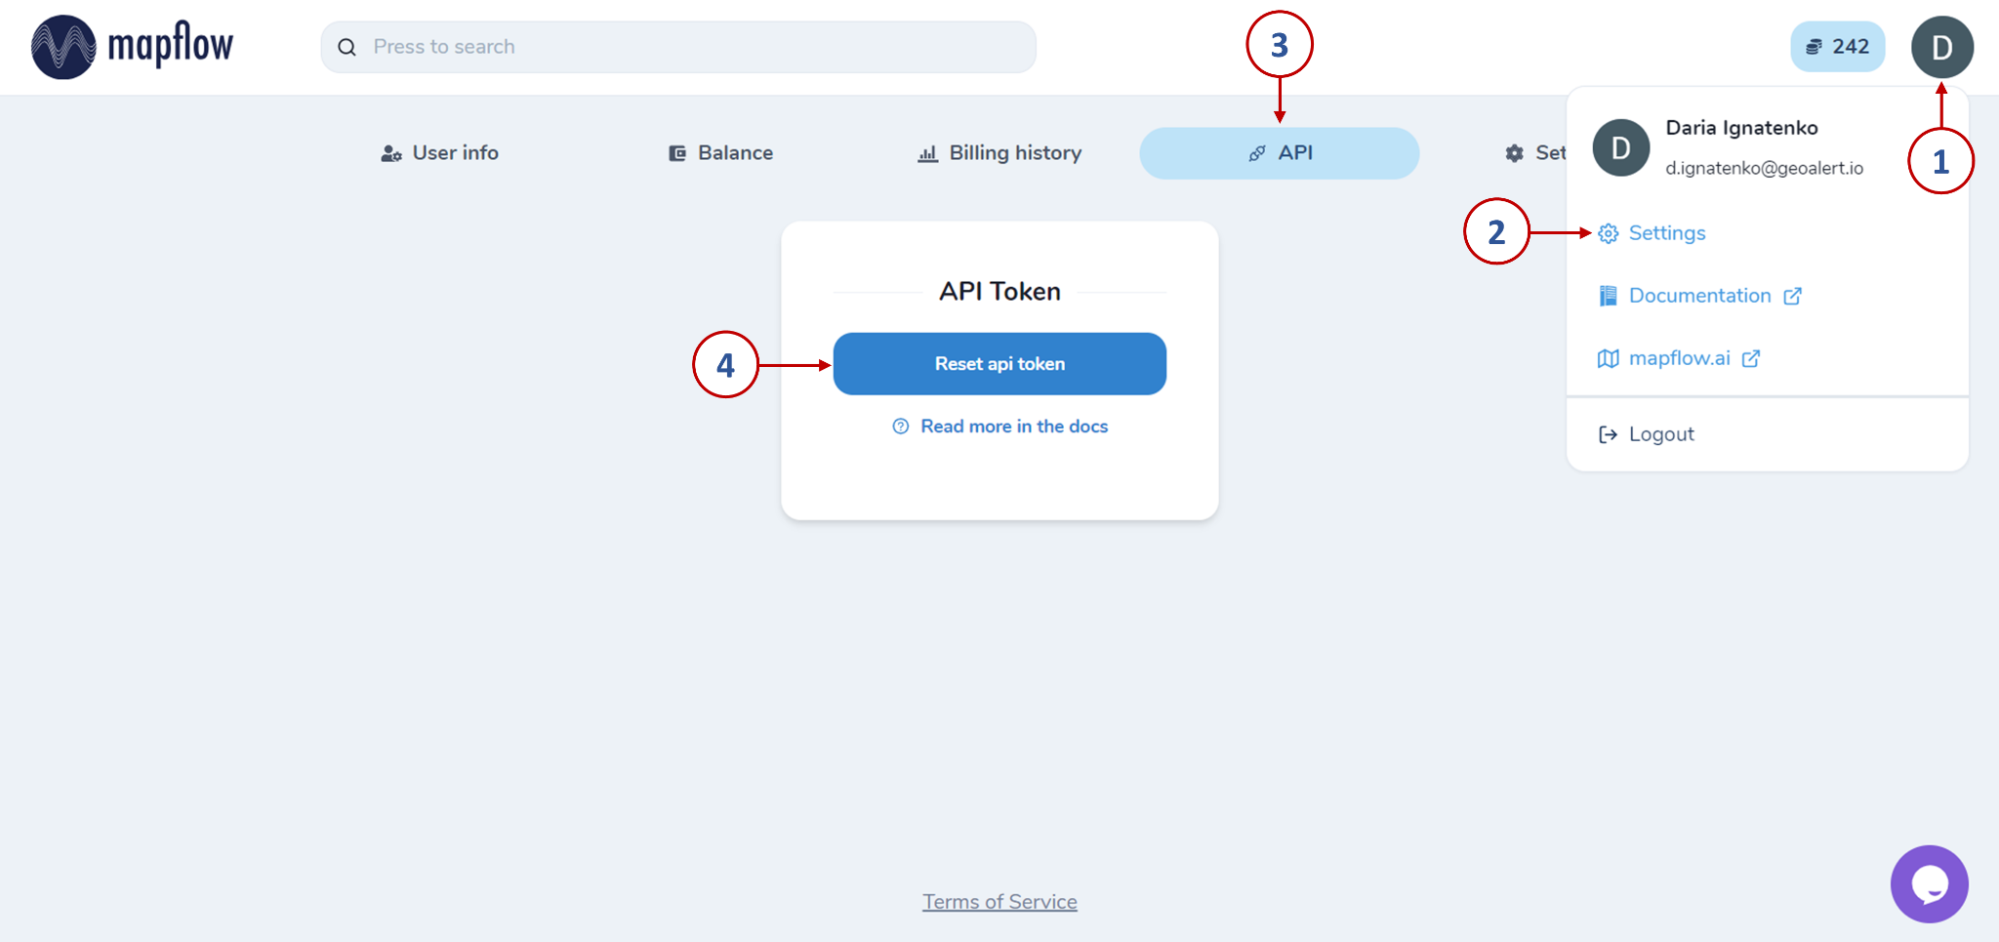
A window will open in which you have to quickly and for free register on Mapflow.ai. After that, by clicking on the user, you need to go to Settings and select the API tab.
By clicking on the “Reset api token” button, you will get access to the authorization key, which must be copied and saved, as well as pasted into the authorization window in QGIS. After that - click “Log in”.
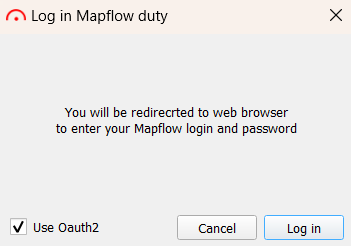
Another way to log in to the plugin is using Oauth2. By checking the appropriate option in the authorization window, you will need to set a master password.
Then, following the instructions, restart QGIS and click “Log in” again. This will redirect you to the browser, where the Mapflow authorization window will open. After successful login or registration, a page will open notifying you of this.
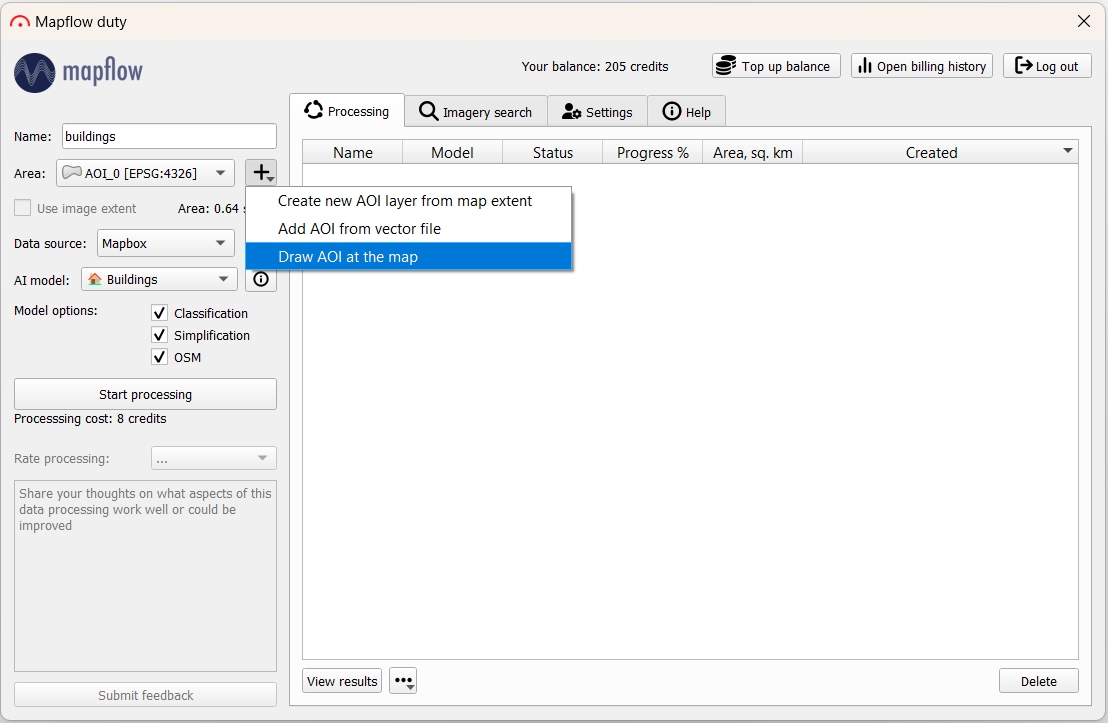
And in QGIS the main tab of the plugin will open, so you can proceed to the next steps.
2. Object recognition using default data provider
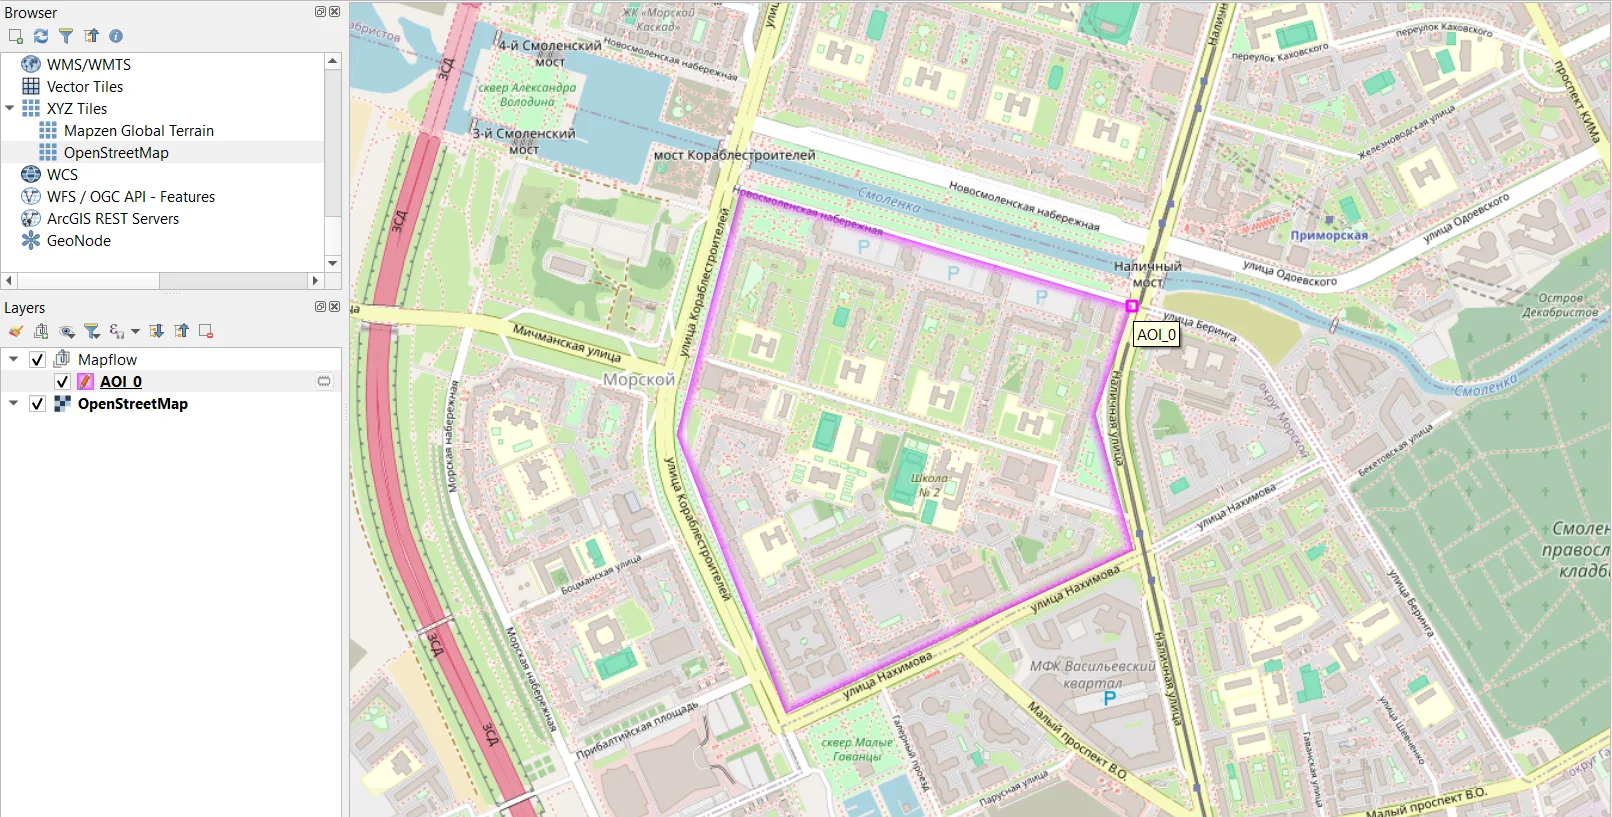
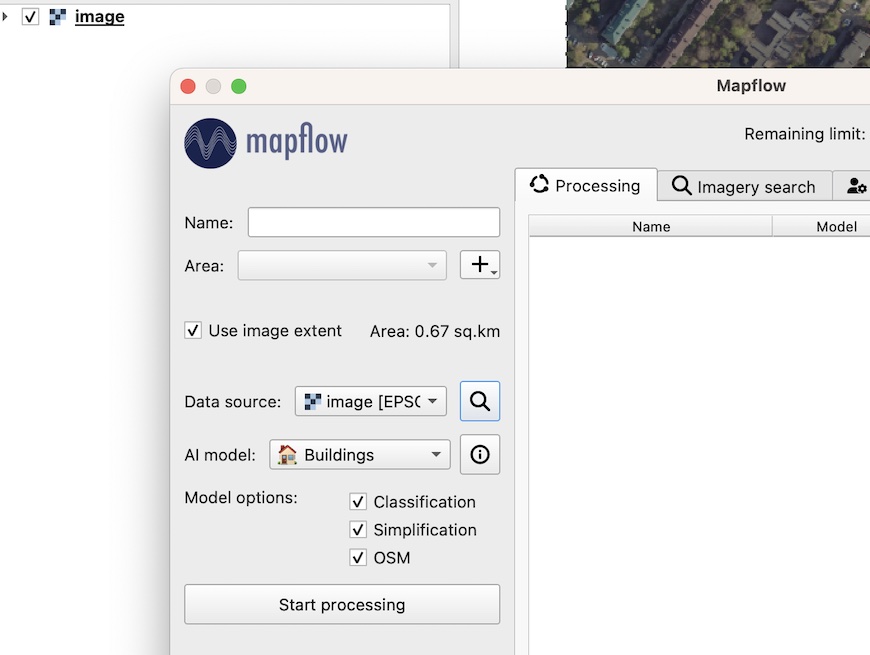
In order to start processing, first you must specify its name. Next, choose the area of interest by drawing it on the map / loading from a vector file / taking the extent of the map.
In the upper-left corner of the main QGIS window in the Browser panel, you can open the OpenStreetMap basemap and navigate around the map to identify the area of interest.
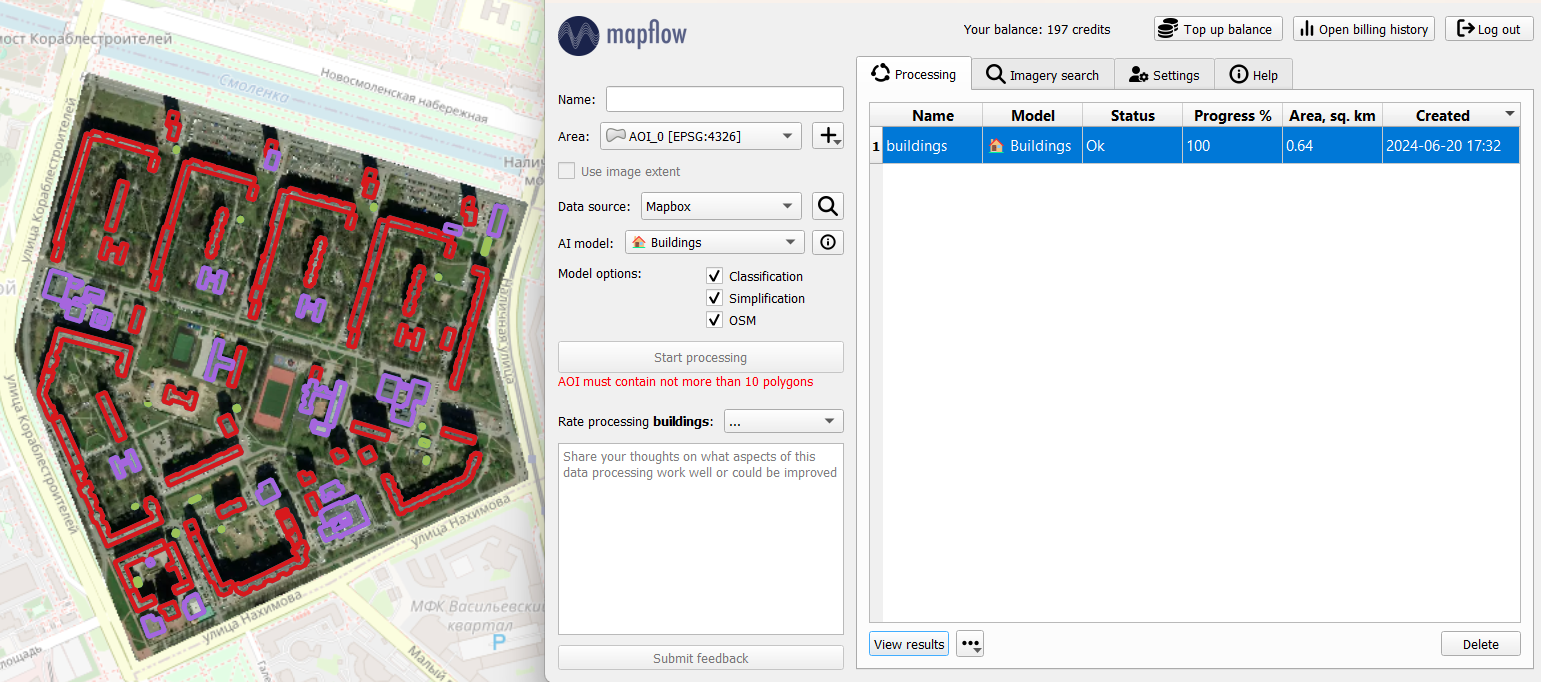
Let’s leave the remaining parameters as default: Mapbox data provider and a model for buildings classification. Then click “Start processing”.
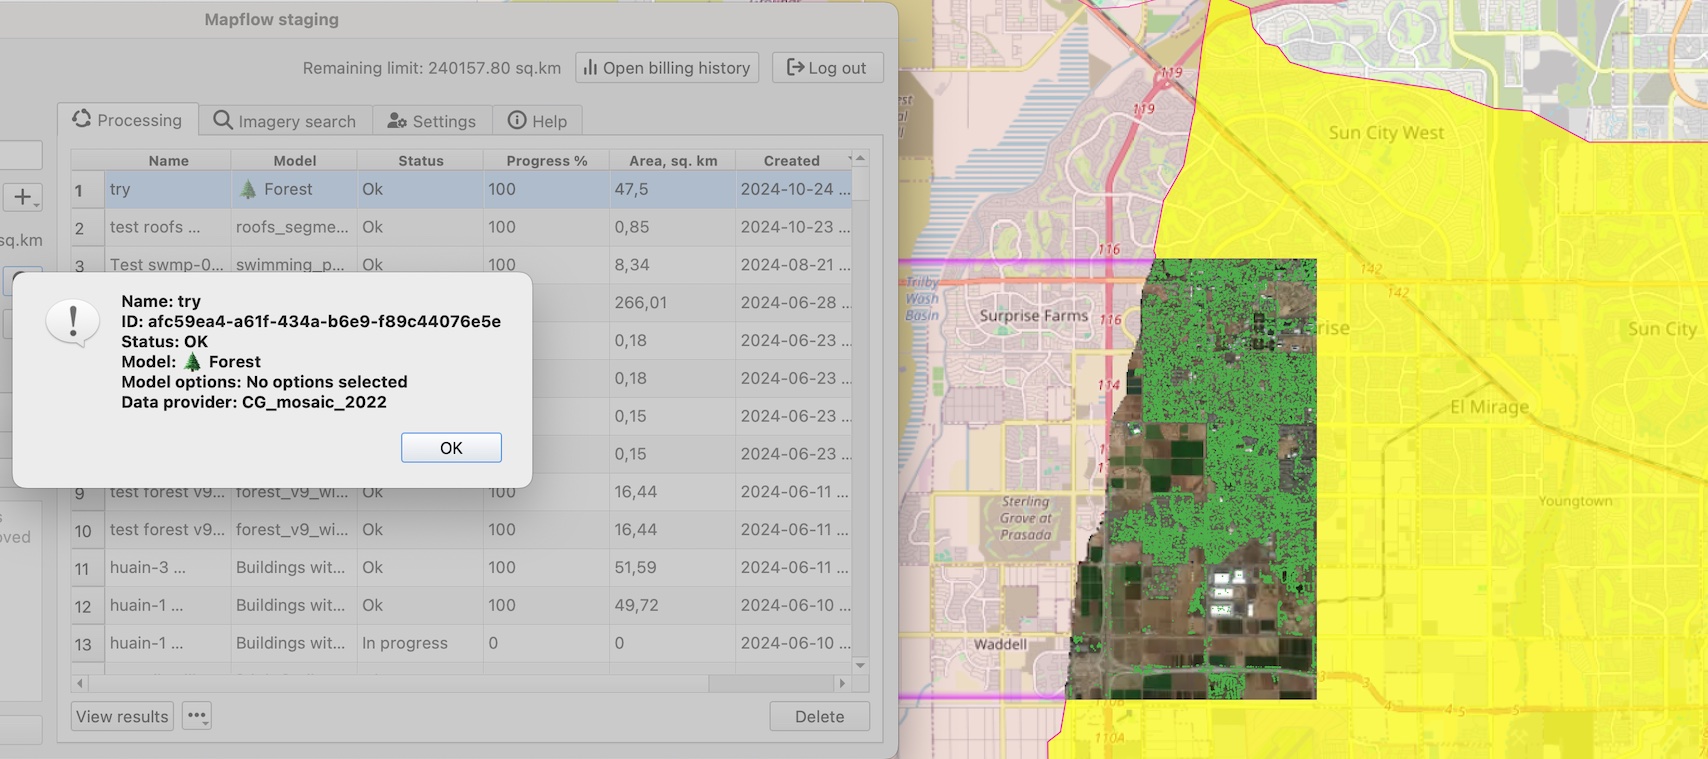
A new row will appear in the processing table. Upon completion of processing (Progress – 100%), after some time, you can load the result to the map by clicking on “View results” (or double-clicking on the row). The raster layer and the identified objects will be displayed on the map: buildings are automatically classified by their type (where red is residential and purple is commercial).
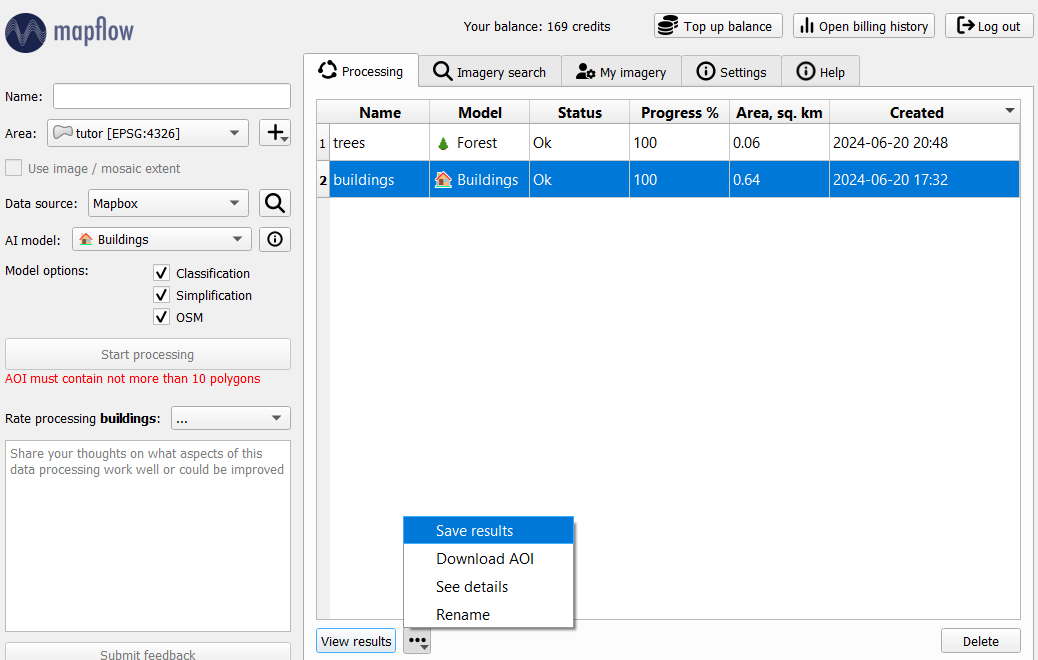
The resulting vector objects can be saved in GeoJSON format (by clicking on the additional options next to View results) and then used for mapping, analysis, or filled with additional attribute information.
3. Object recognition using your own imagery
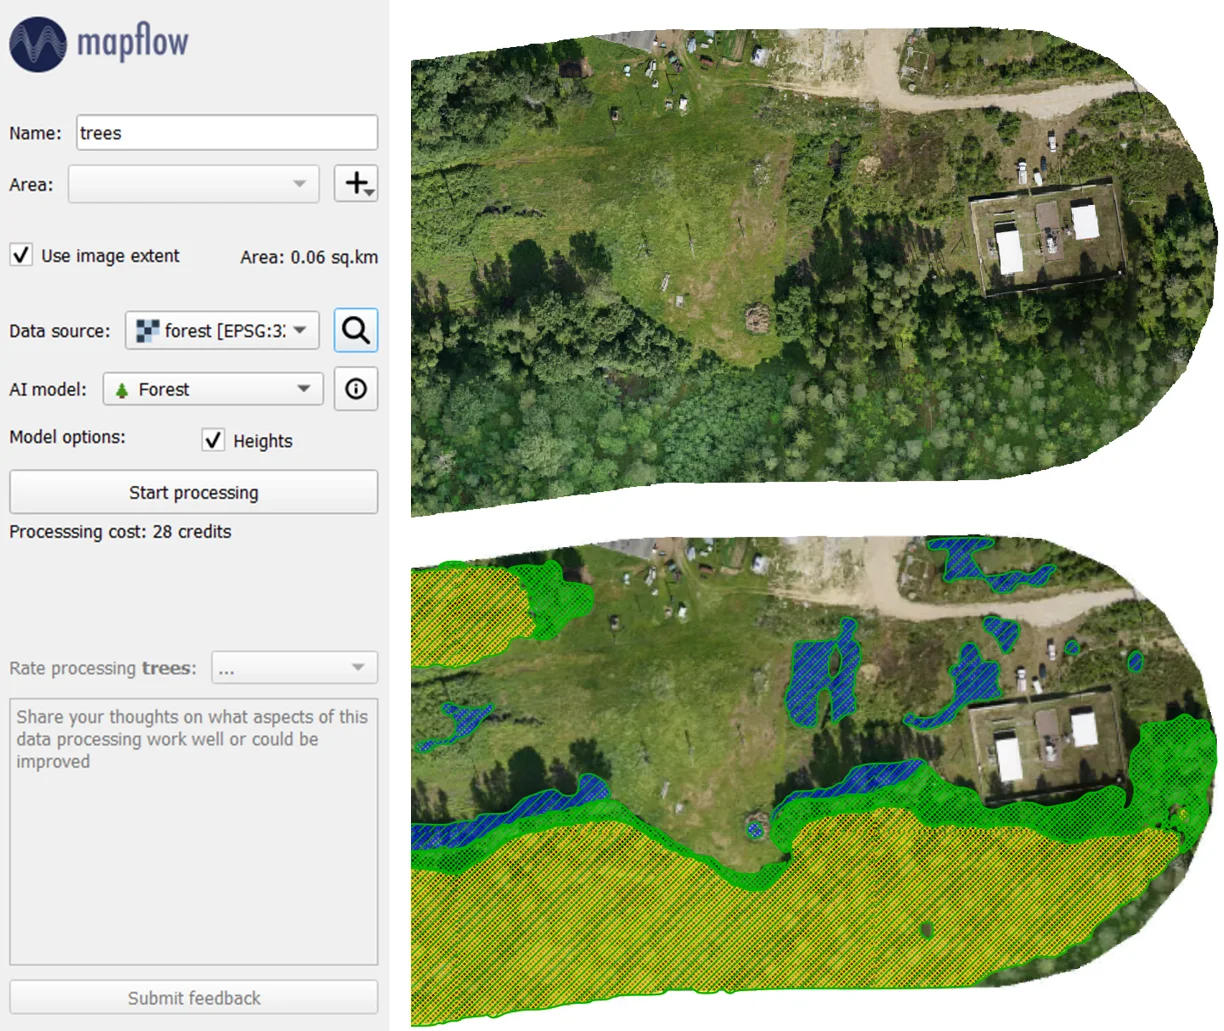
Previously, we looked at one of the simplest scenarios for working with the Mapflow plugin. However, its functionality is not limited to a single data provider. In addition to the default providers, you can use the search in the imagery catalog or process your own images.
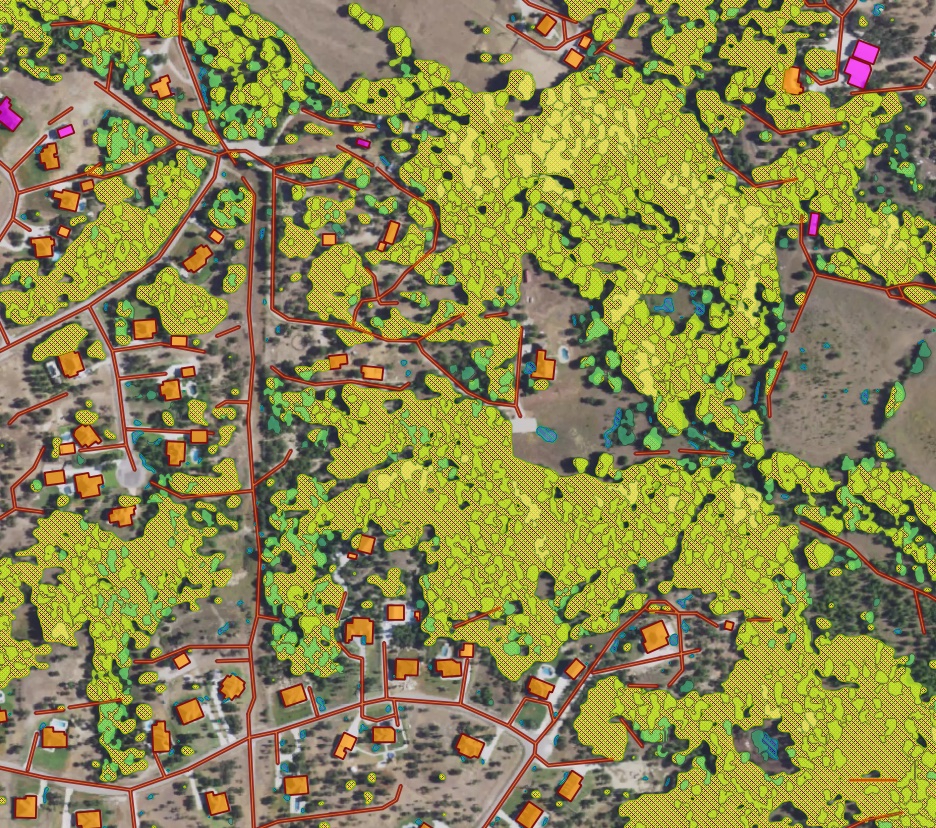
After adding the image you are interested in to QGIS as a raster layer, you can select it in the “Data source” field and run processing. The result can look like this: the boundaries of trees of different heights, identified in your image.
In this quick tutorial, we looked at the main options for detecting objects in remote sensing images with the help of the Mapflow plugin for QGIS. In addition to buildings and forest vegetation, there are models for recognizing roads or construction sites. A more extensive overview of the plugin’s capabilities, as well as various options for data sources, are discussed in the documentation for Mapflow <> QGIS.
Unmanned aerial vehicles – UAVs or, more commonly, drones – have become a deeply integrated part of the geomatic industry over the last ten years. This is owing to their increasing usability, falling hardware costs, and easing government regulations. Yet, as more data is available with UAV surveys, more data need to be processed operatively.
To process your UAV data you might be looking for some cloud or desktop software to create a mosaic or orthophoto. Do you know that you can easily publish your data with Openaerialmap and analyze (say detect and calculate some objects and calculate their areas) with Mapflow QGIS or Mapflow Web?
Let’s take the “UAV buildings” 🏠⭐️ Buildings (Aerial) (CUSTOM) model that extracts the detailed building outlines (the recommended image resolution is 10 cm).
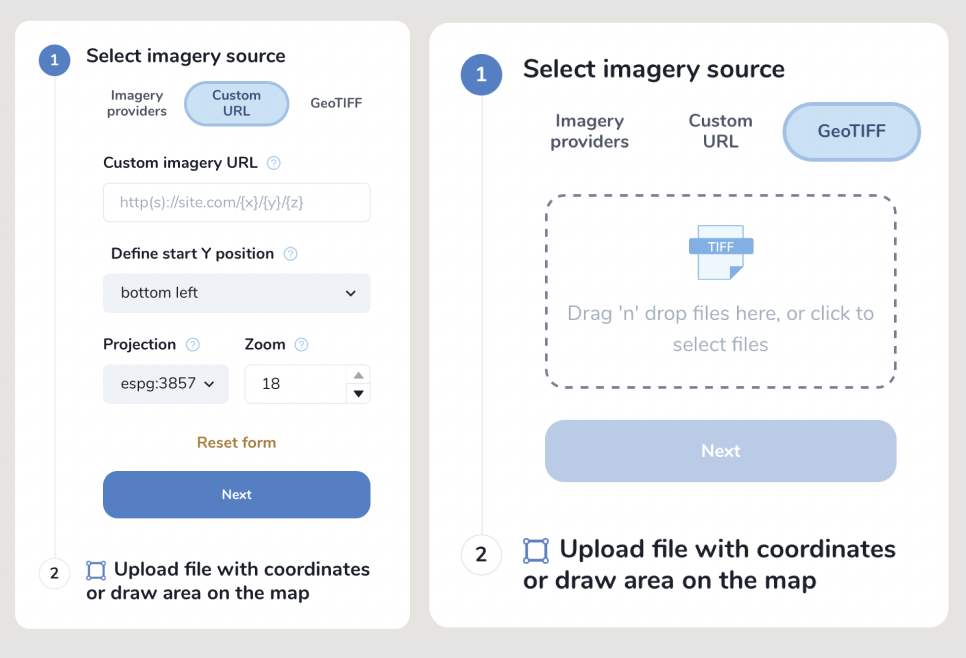
Select raster source – you can either use Custom URL (see below how to publish your image with Openaerialmap and get the TMS link) or upload your image as GeoTIFF.
Warning
Currently, a preview of the uploaded image is not possible after loading the image, you will preview only the area of its extent.
2. Define the processing Area.
The processing area (AOI) must be located within the area of the image extent, otherwise, the area will be cut off by the extent boundaries. The processing area size is calculated by the intersection of the image extent and the AOI.
Important
Image upload requirements:
The file size must be less than 1 Gb. Both sides image dimmesions must not exceed 65535x65535
The image must be georeferenced and the CRS must be one of:
* WGS84 (EPSG: 4326)
* Web mercator (EPSG: 3857)
* UTM (any zone)
If your image doesn’t meet the parameters, we suggest using Mapflow API / QGIS plugin which has more capabilities.
Mapflow supports RGB imagery and also processes single-band (panchromatic) imagery, but the AI models are not tuned for such kind of data, so the quality of the result may be worse than expected.
You can upload your own GeoTIFF (up to 1 GB, max. 65535x65535 px. by default). All raster layers loaded in your QGIS (1) are visible in the drop-down list (2) and can be selected for upload.
Important
Please, consider the requirements for AI Models when uploading your own images.
Contact us if you have difficulties to handle a large dataset or your file size exceeds our limits.
Use Openaerialmap as an imagery publication and access service
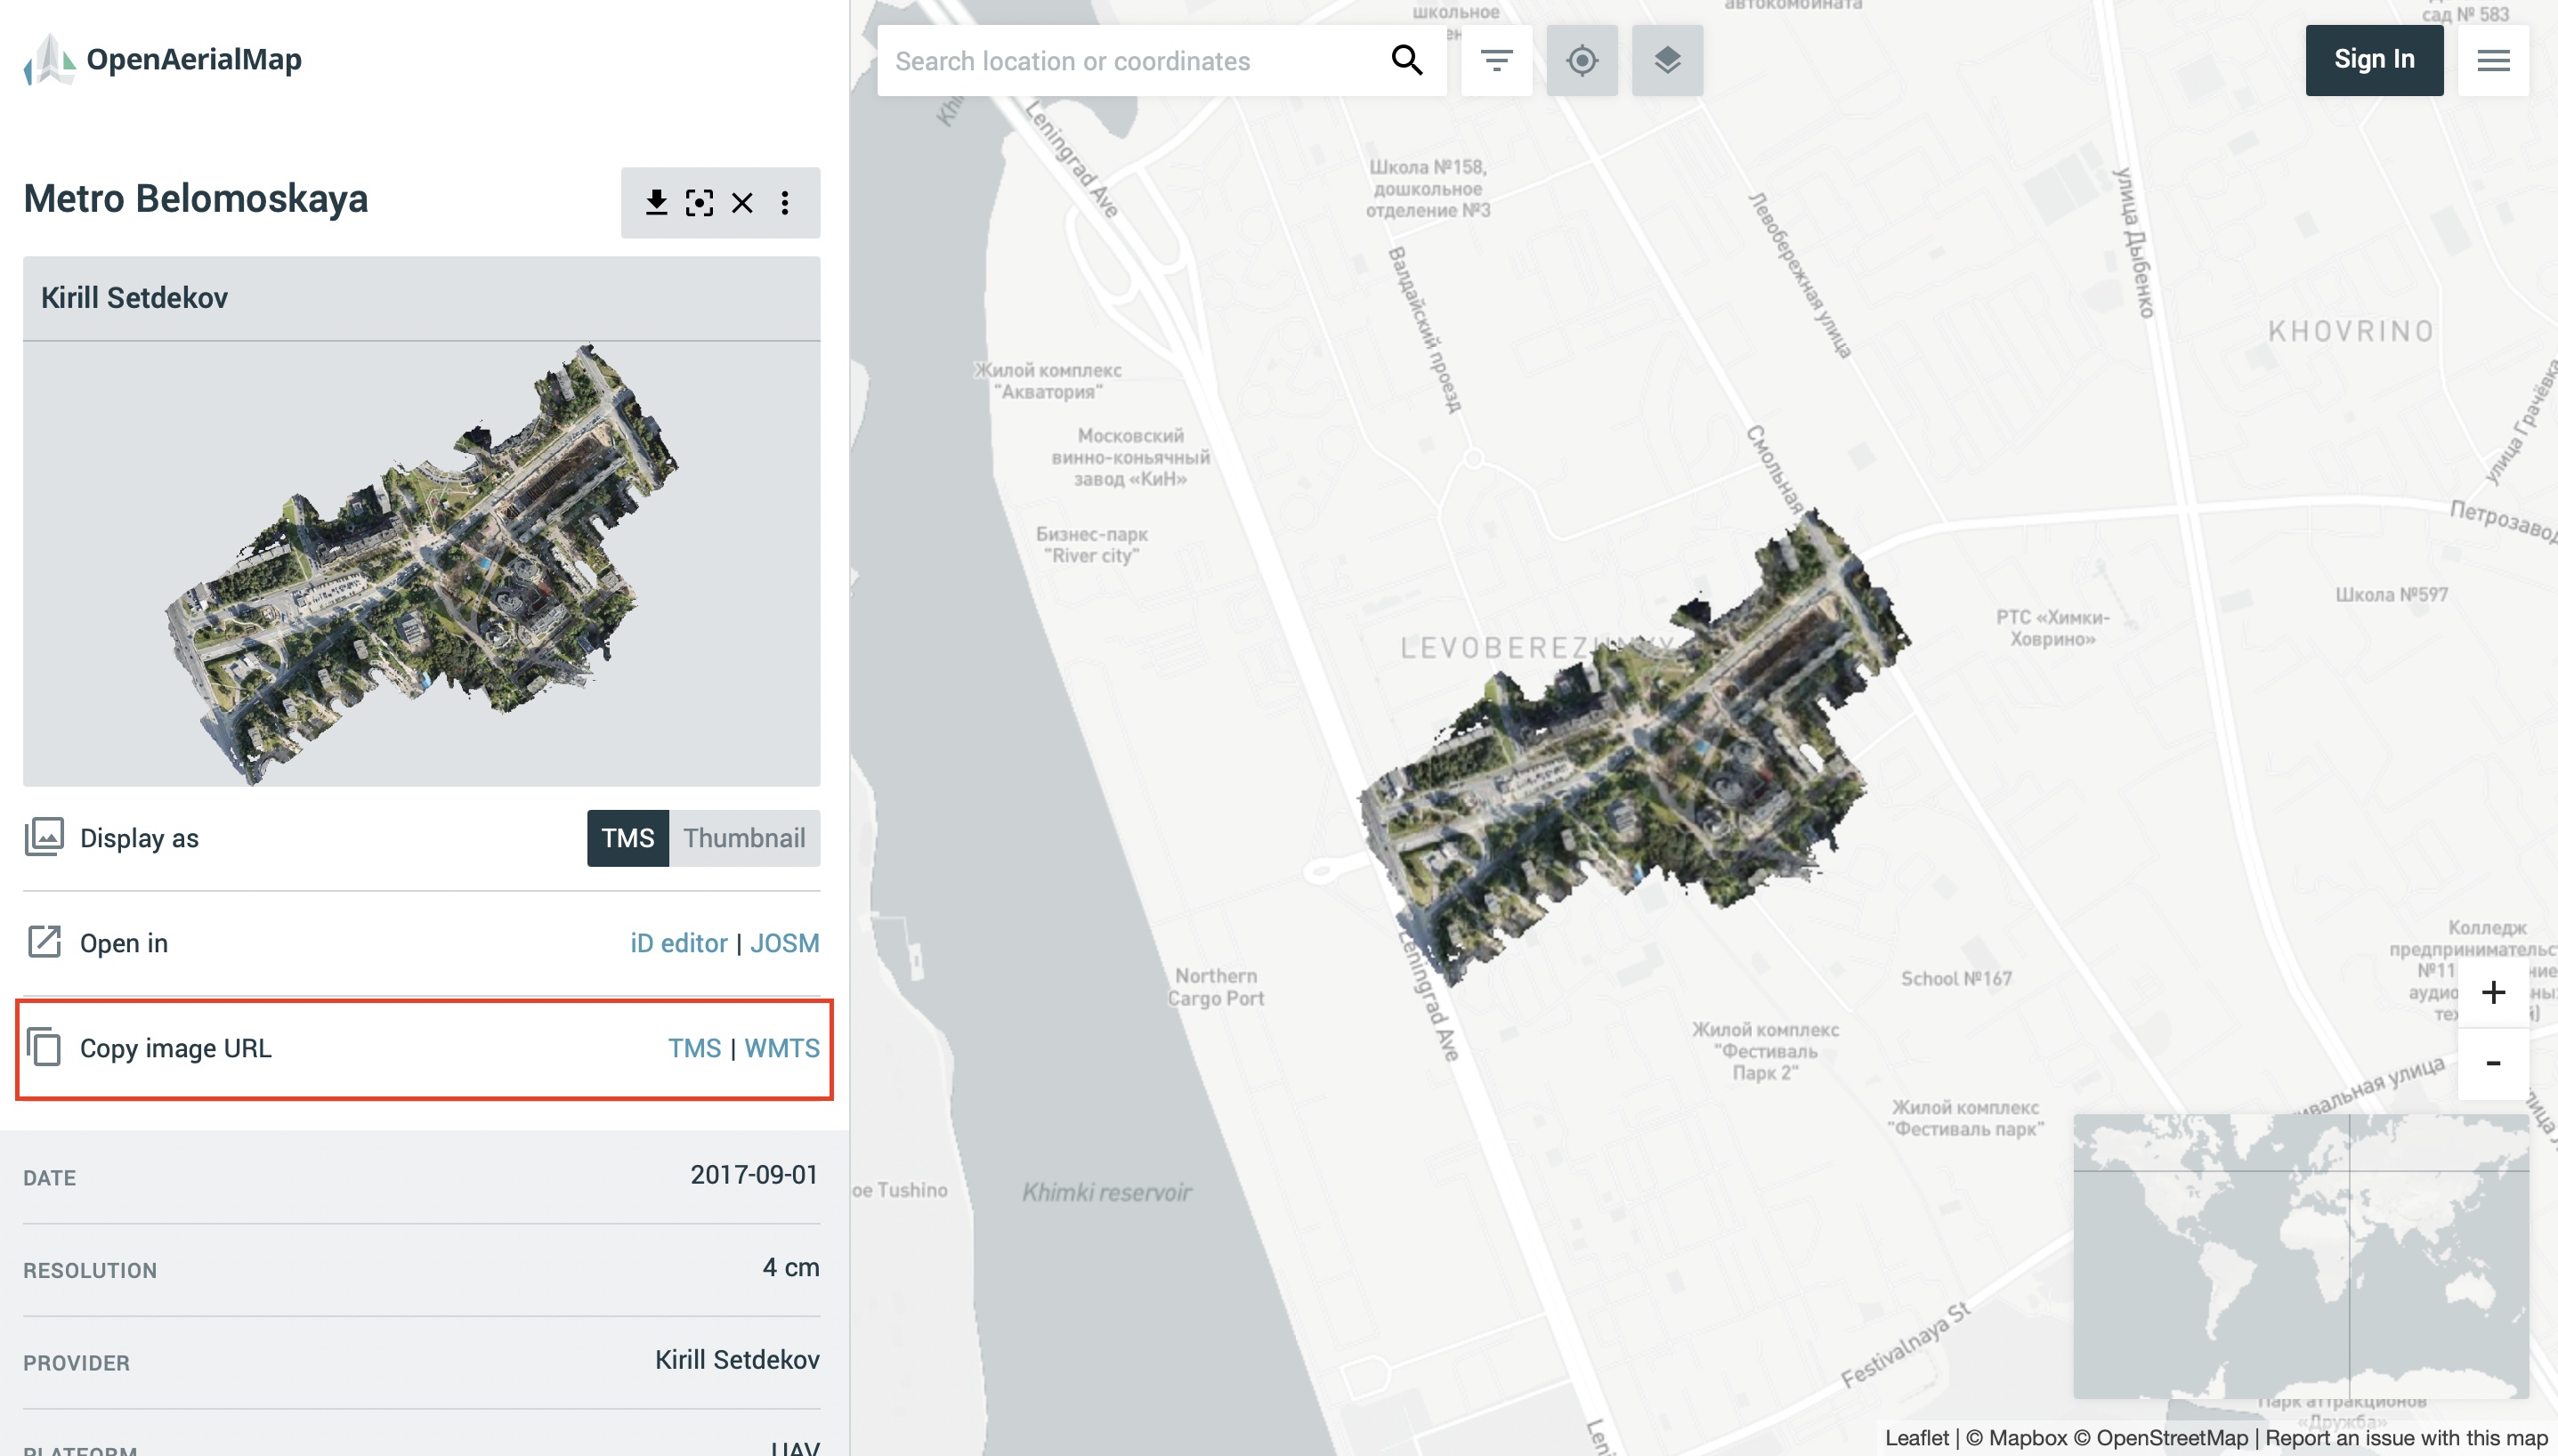
OpenAerialMap is an open collection of UAV imagery data, crowdsourced by users. The project is supported by a consortium of companies developing open source software and services for working with spatial data.
As soon as your aerial image is published on OpenAerialMap it’s presented on the public map and can be fetched using TMS/WMTS protocols.
Select the image and copy link to TMS to connect it to Mapflow Custom URL.
Copy link to TMS and paste it into the “Custom imagery URL” in your new Mapflow processing.
Check if you see the image on the map, go through the next steps (AI model, processing params) to and start the processing.
..note::
Your can use this service to publish your own UAV data (note that it will become publicly accessible).
As soon as your aerial image is published on Openaerialmap it’s displayed on the public map and can be connected using TMS/WMTS or downloaded as GeoTIFF file.
Both ways are OK to work with Mapflow.
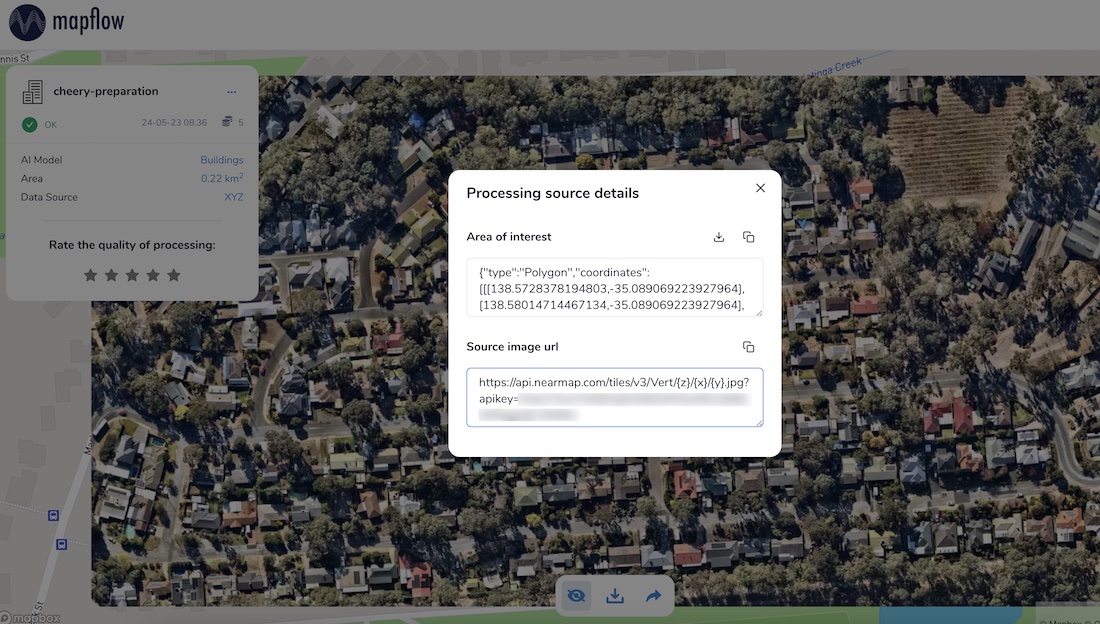
Nearmap provides access to its Vertical and Panorama Imagery via a Tile API. If you have a subscription to their service you can use it easily with Mapflow Custom URL.
NAIP (National Agriculture Imagery Program) provides public access to aerial imagery for the US territory. The data is available as a set of tiles via TMS protocol. It’s effectively public-domain data so you are free to use, redistribute, incorporate into commercial or open-source projects, or mix with other data.
To use NAIP data with Mapflow Custom URL, you can use the following TMS URL template:
Here are few tips on how to prepare and optimize your data and reduce the image size to upload it faster and not to exceed the Mapflow upload limit.
Usually UAV image is an RGB compiosite provided as GeoTIFF of 16 or 8 bit.
The data type will be automatically converted to 8 bit on the side of the Mapflow.
Alternatively: use the preprocessing script for preparing your image for Mapflow processing.
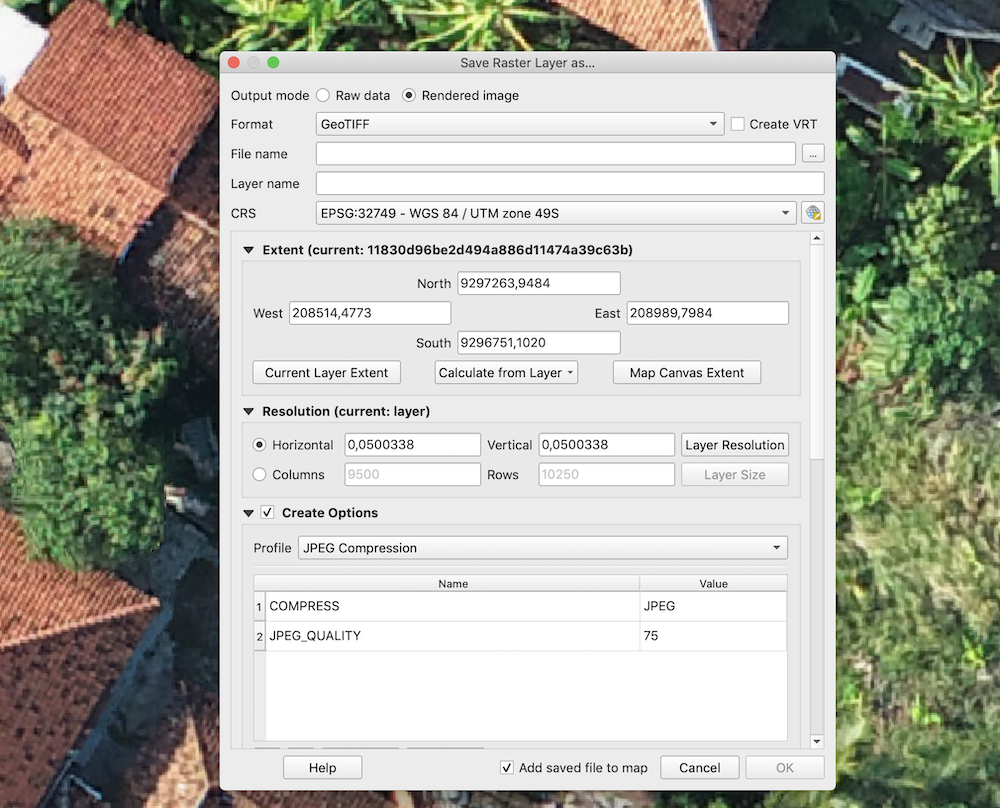
You can reduce the size of the image using GDAL translate. (https://gdal.org/)
E.g. using JPEG compression.
gdal_translate-cocompress=JPEGinput.tifoutput.tif
By default the compression quality is 75% (gdal_translate-cocompress=JPEG-cojpeg_quality=75input.tifoutput.tif) but it doesn’t really impact the quality of the Mapflow mask whenever the resolution of the input iage meets the recommended params.
The same can be done using QGIS interface:
Tell us if you have more tips to share with the community or if you have more questions – we are ready to help.
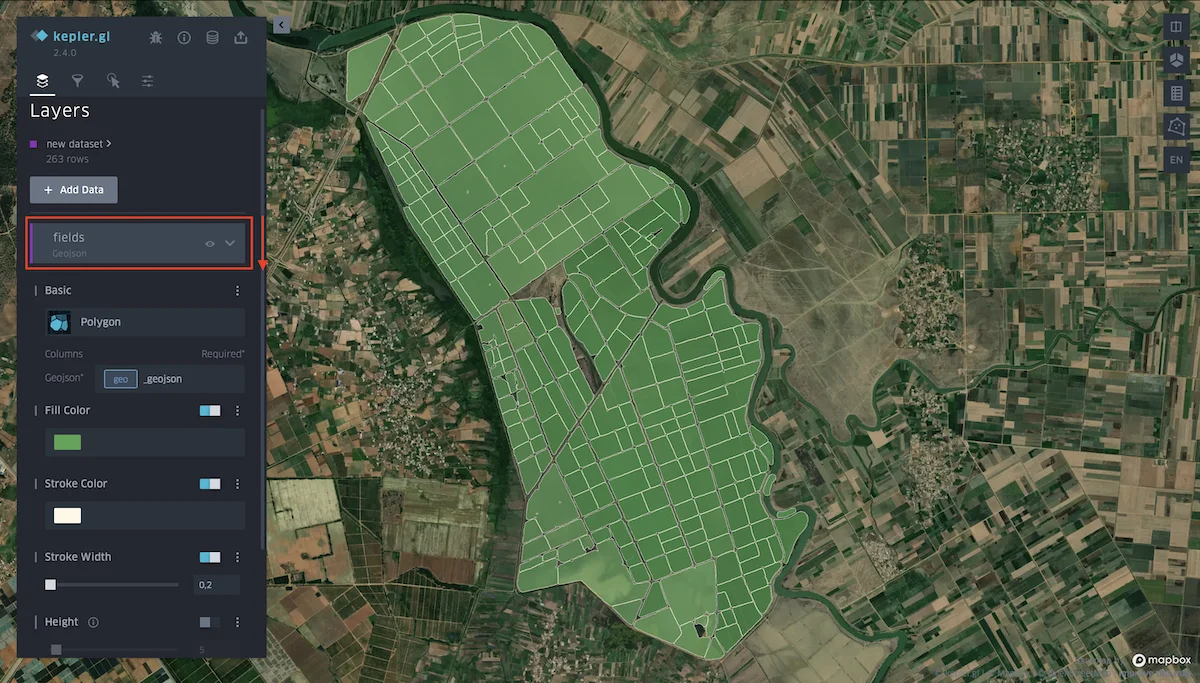
Click on the layer name to bring up the Layer settings from the drop-down menu. To hide all data, click on the eye icon.
These settings allow you to choose a more suitable type of received data:
Fill color. You can choose any color from the palette for polygons, and also hide the display of data by changing the position of the slider. You can change the transparency of polygons (property Opacity) in the additional settings of this function.
Stroke color. You can choose any color from the palette for outlining polygons, as well as completely remove the stroke. You can change the transparency of the stroke (property Opacity) In the additional settings of this function.
Stroke width. Controls the thickness of the stroke.
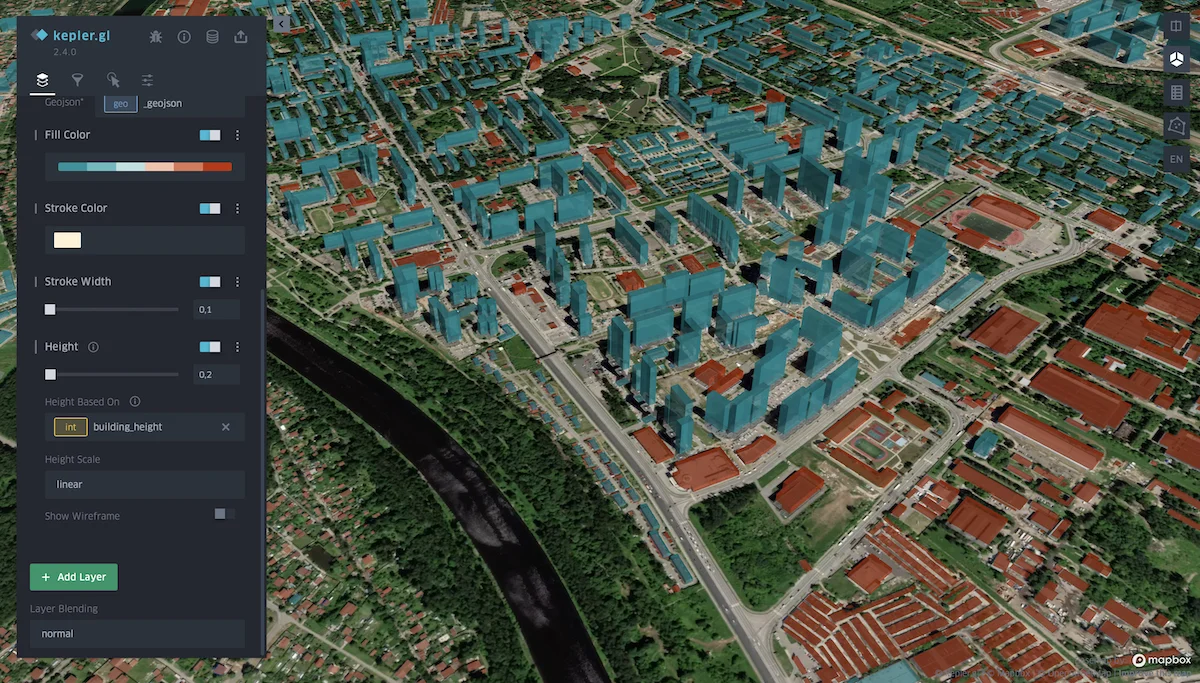
Height. Allows you to view data with heights in 3D format. Set the desired coefficient and select the attribute of the layer with heights.
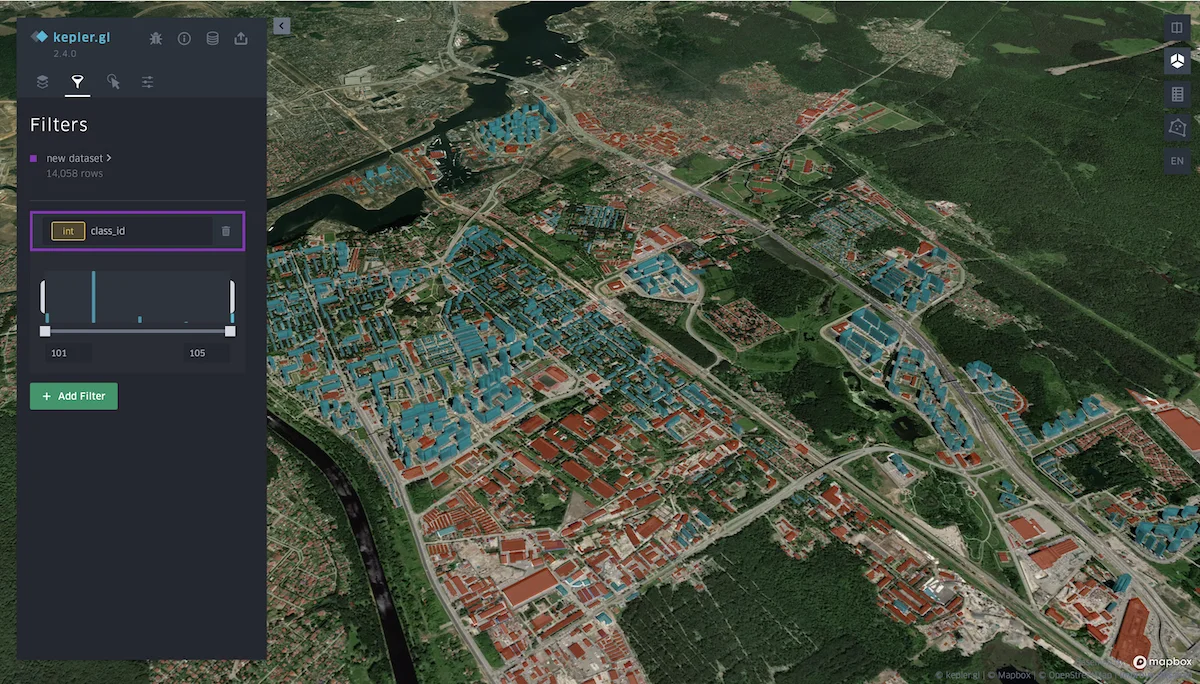
This tab allows you to add a filter of interest by a specific attribute of the layer (as in this case, the filter is set by classes with different typology of buildings).
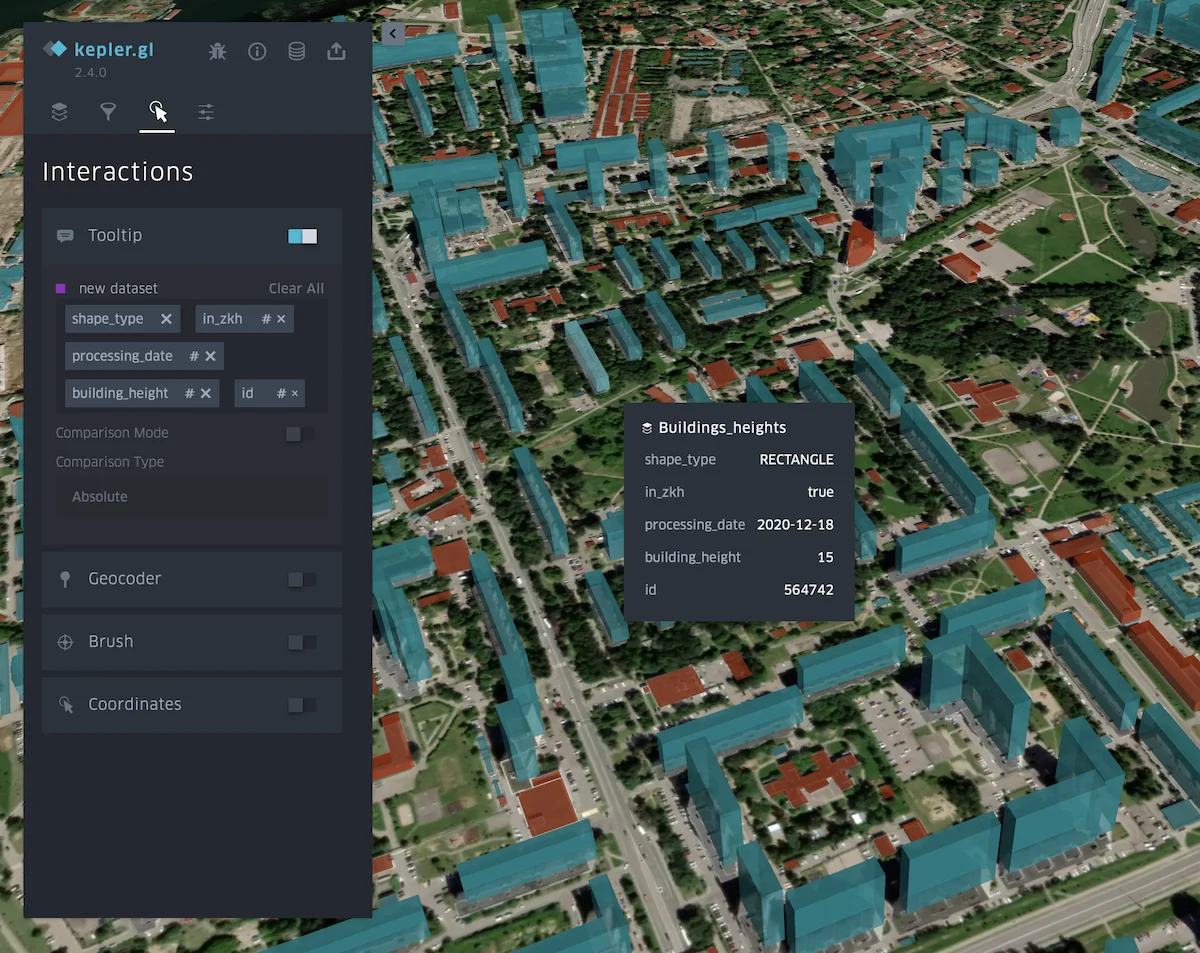
You can select or remove attributes that will be visible in the menu that appears when you hover over an object. It is also possible to turn on the panel indicating longitude and latitude.
Currently, you have to contact us if you have a request to run Mapflow (as a platform or as a separate imagery analysis workflows) on external infrastructure.
However, we partner with cloud integrators to conduct projects for their clients.
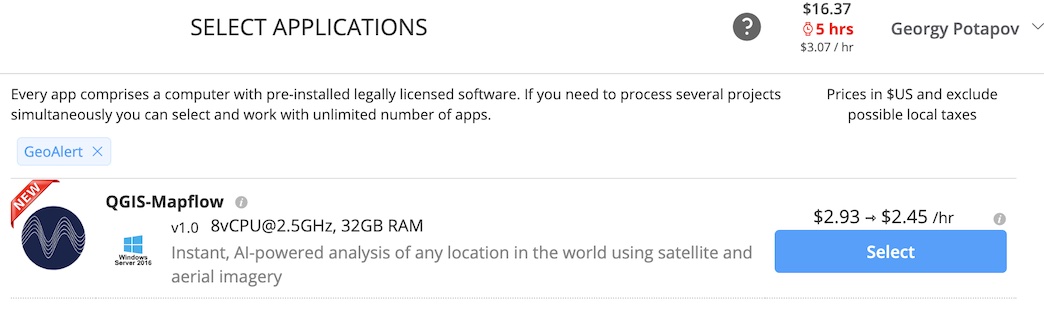
Create an account at Geocloud and run the app “QGIS-Mapflow”.
It runs the virtual machine with minimum requirements for QGIS with a preinstalled Mapflow plugin.
Note that you have to run consequently the Storage and the Desktop to get connected to the virtual machine with a remote desktop.
Run QGIS by clicking on the “QGIS-Mapflow” icon at the desktop workspace
Run the plugin by clicking on the icon in the toolbar
Important
❗️ To enable Mapflow oAuth login use the master password for QGIS which is set to 123456
Note
After you click the “Login” button you will be redirected to the Mapflow login page in the browser. Use your existing Mapflow.ai login and password or create a new account to start working with the plugin.
You can also use Basic auth (disable “Use OAuth” checkbox) with your Mapflow Token.
Note that you pay only for the up time in Geocloud. You spend your regular credits for Mapflow (you get 250 credits for free upon the registration).
There are two prices for Storage / Computer in Geocloud - Stopped and Working. The Stopped price is applied when Storage / Computer is stopped. The Working price is applied when it is in the working mode. 👉👉 You can stop your computer while doing some long-lasting calculations in Mapflow to spend less.
How to check images metadata in the 🌏 Global mosaic
Mapflow Imagery Search enables searching metadata for mosaic providers (e.g., ArcGIS World Imagery, Global mosaic).
Note
🌏 Global mosaic is the annually updated satellite imagery composite covering most of the World. The mosaic is composed of “Jilin” Chinese satellites imagery (RGB, 0.75–0.5 m/px). The preview is limited to zoom 14.
🌏 ArcGIS World Imagery is a provider of the global coverage composed of high and medium resolution satellite imagery and aerial imagery, hosted by ESRI. The frequency of updating images is 1-5 years depending on the territory.
How to use Mapflow – QGIS to search for mosaic’s metadata and run the analysis:
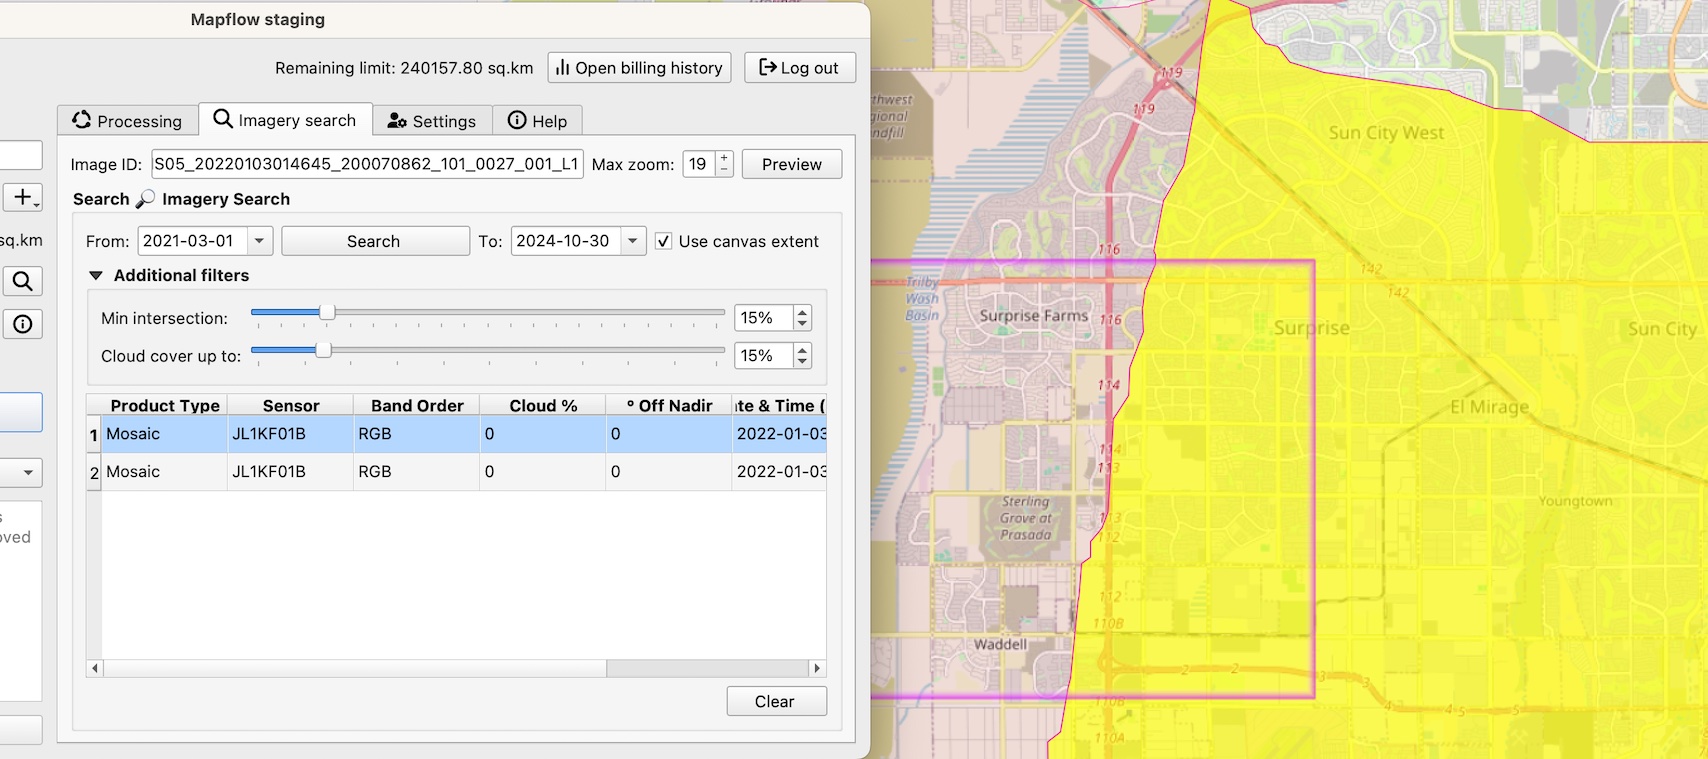
Switch to the Tab “Imagery Search”
Set search filter parameters including the area (it can be your area of analysis or a map canvas), period of time, cloud %, and the % of the intersection with AOI.
Select the “Product type = Mosaic” in the Search results. You will see the mosaic image “cutline” indicating the specific image that is used in the mosaic.
Note
There are two types of products in the Imagery Search API available:
* The Scene product is available for ordering by request. Now you need to contact us to order the specific image.
* The Mosaic product is available for instant analysis if the corresponding data provider is linked to your Mapflow account.
Run the processing. The resulting area of analysis will be clipped by the intersection with the area of analysis.
To run the processing over the whole area of analysis – just clear the selection and use the Data Source: 🌏 Global mosaic 2022 or the Data Source: 🌏 ArcGIS World Imagery.