The core of the Mapflow are the Mapping Models. Mapflow enables to detect and extract features in satellite and aerial images powered by semantic segmentation and other deep learning techniques. See requirements page to better understand what data to use with each model, and price list for breakdown of the processings billing.
Note
For the data requirements – see Model requirements. For the breakdown of the Mapflow processings billing – see Mapflow pricing.
AI-Mapping Models
🏠 Buildings
Extracting of rooftops of buildings from imagery of high resolution. High performance deep learning model is trained to detect the buildings roofs.
Model tags 🏷️
- Version
2026-07-06
- Geo Domain
Global
- Model method
Segmentation
- GSD / Map Zoom
0.3 m / z19
Note: The building predictions with area less than 20 sq.m. are removed to avoid clutter
The model does not extract the footprints directly, because they are not clearly visible in the images, but it can obtain them, just like human cartographers, by moving the roof to the bottom of the wall (see Additional options).
Additional options:
Classification by types of buildings – typology of buildings is represented by the main classes (see reference).
Regularization - the algorithm corrects the irregularities of the contours of our model. The irregular geometries are replaced with rectangles, circles or arbitary polygons with 90 degree angles, which fits better to the original shape. This option produces much more map-friendly shapes which look better, but some original mask accuracy can be lost.
Simplification - simplifies the building shape, staying close to the original mask, adjusted for curve and complex shapes. More approximated shapes, but less right angles.
Merge with OSM - some of the areas have great coverage of OpenStreetMap data, and if you prefer human-annotated data, you can select this option.In this case, we check for each building whether it has a good corresponding object in OSM (Jaccard index) and if there is one, we replace our result with OSM polygon. This makes the result not based on the image, so the buildings can be shifted from actual positions. Also the corrected buildings are rotated to align with the nearest roads downloaded from OSM.
Height Estimation (beta) – feature leverages a dedicated regression-based model that infers height using visual indicators such as shadow length and visible wall segments. The result is what is termed 3D building footprints where the building’s countour is projected to ground level instead of the roof outline. This is especially useful for oblique imagery, where roofs often appear shifted.
Benchmarks - segmentation
Aerial imagery
Latest update — 🏠 Buildings v.2026-07-06 (Global, Segmentation, 0.3 m / z19). The model was evaluated on a global validation set of 7 areas of interest (AOI) against manually annotated ground truth. Metrics are area-based: IoU is the intersection-over-union of the predicted and ground-truth building masks, and F1 / Precision / Recall are computed on the overlapping mask area.
AOI (location) |
Predicted features |
IoU |
F1 |
Precision |
Recall |
|---|---|---|---|---|---|
United States — Fort Myers |
65 |
0.907 |
0.951 |
0.983 |
0.921 |
United States — Phoenix |
47 |
0.903 |
0.949 |
0.944 |
0.953 |
Canada — Rigaud |
103 |
0.870 |
0.930 |
0.934 |
0.927 |
Australia — Adelaide |
92 |
0.868 |
0.929 |
0.914 |
0.945 |
New Zealand — Lower Hutt |
106 |
0.867 |
0.929 |
0.956 |
0.903 |
New Zealand — Wellington |
76 |
0.838 |
0.912 |
0.900 |
0.924 |
United Kingdom — London |
68 |
0.813 |
0.897 |
0.873 |
0.922 |
Côte d’Ivoire — Bangolo |
102 |
0.663 |
0.797 |
0.844 |
0.755 |
South Africa — Worcester |
156 |
0.592 |
0.744 |
0.867 |
0.651 |
Aerial (mean of 9 AOIs) |
815 |
0.813 |
0.893 |
0.913 |
0.878 |
Area-based IoU / F1 / Precision / Recall measured against ground-truth building masks; evaluation run 2026-06-13.
Satellite imagery
Additional validation of 🏠 Buildings v.2026-07-06 on satellite imagery across 5 dense urban areas of interest.
AOI (location) |
Predicted features |
IoU |
F1 |
Precision |
Recall |
|---|---|---|---|---|---|
Russia — Ufa |
426 |
0.821 |
0.902 |
0.897 |
0.907 |
Saudi Arabia — Riyadh |
225 |
0.817 |
0.899 |
0.920 |
0.879 |
India — Bangalore |
508 |
0.779 |
0.876 |
0.859 |
0.894 |
India — Thane |
429 |
0.768 |
0.869 |
0.889 |
0.849 |
United Arab Emirates — Abu Dhabi |
142 |
0.751 |
0.858 |
0.828 |
0.890 |
Satellite (mean of 5 AOIs) |
1730 |
0.787 |
0.881 |
0.879 |
0.884 |
Area-based IoU / F1 / Precision / Recall measured against ground-truth building masks; evaluation run 2026-06-16.
See also
📊 See per-location benchmark details for the area-by-area breakdown of both the global and satellite sets, including comparison with the previous version and prediction-vs-ground-truth overlays.
🌲 Forest and trees
The model is trained on high-resolution data (0.6-0.3m) for different areas and climate zones.
The result includes all areas covered with tree and shrub vegetation, including sparse forest and shrublands.
Model resolution allows to detect small group of trees and narrow tree lines.
The model is robust to region change, and performs well in most environments, including urban. The image should be taken in active vegetation period, because leafless trees or vegetation covered with snow are not the target class.
Latest model tags 🏷️
- Version
2026-07-03
- Geo Domain
Global
- Model method
Segmentation
- GSD / Map Zoom
0.6–0.3 m / z18–19
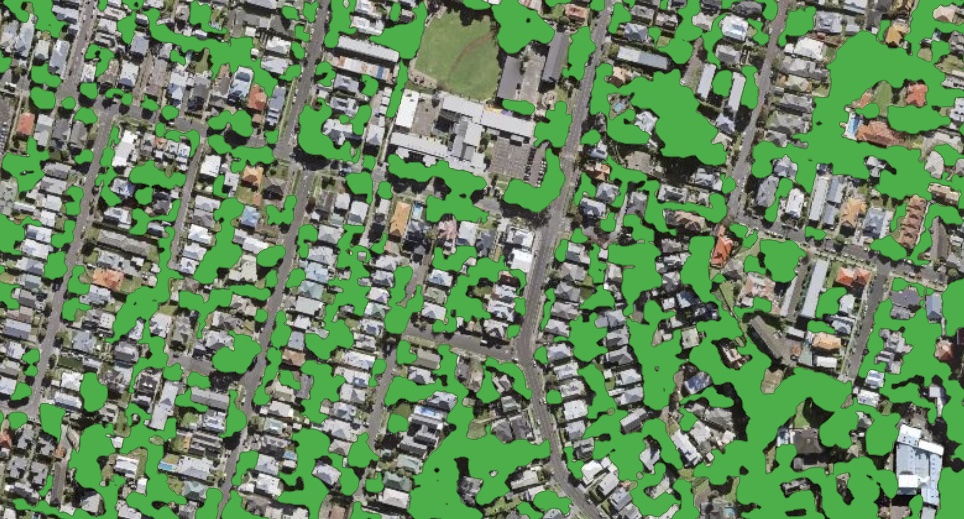
Sample of processing results for solid Forest mask
Additional options:
Height estimation – forest mask classification by height classes
Tree crown polygons - extracts tree crowns from forest vegetation as well as free-standing trees, provides them as polygons
Tree crown points - extracts tree crowns from forest vegetation as well as free-standing trees, provides them as points
Important
We recommend using the Tree crown options with 0.3m resolution imagery (~ 19 zoom) for the best results in case you need to detect individual trees.
Note
Forest Height classification follows the following classes:
Shrubs lower than 4 meters;
Forest from 4 to 10 meters high;
Forest more than 10 meters high;
This classification is used as a decision support for the vegetation management in powerline zones, etc. See the professional solutions by Geoalert. The tresholds can be customized depending on the requirements.
Processing results samples
Sample of results for Tree crowns, points
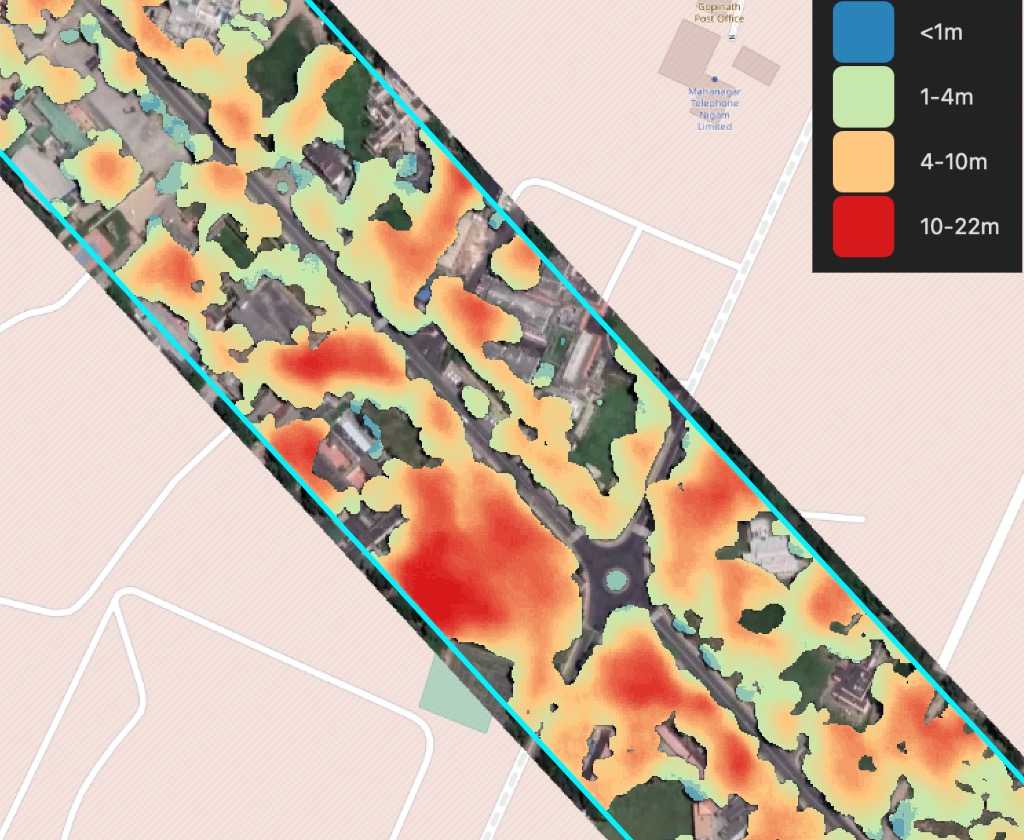
Sample of results for Forest with heights mask (raster output)
Benchmarks - segmentation
Latest update — 🌲 Forest and trees v.2026-07-03 (Global, Segmentation). The model was evaluated on a validation set of 6 areas of interest (AOI) against manually annotated ground truth. Metrics are area-based: IoU is the intersection-over-union of the predicted and ground-truth vegetation masks, and F1 / Precision / Recall are computed on the overlapping mask area.
AOI (location) |
Predicted features |
IoU |
F1 |
Precision |
Recall |
|---|---|---|---|---|---|
Italy — Crotone |
254 |
0.862 |
0.926 |
0.944 |
0.909 |
Spain — Madrid |
368 |
0.813 |
0.897 |
0.880 |
0.915 |
Philippines — Balanga |
220 |
0.806 |
0.892 |
0.864 |
0.923 |
Spain — Velilla de San Antonio |
1070 |
0.784 |
0.879 |
0.894 |
0.864 |
Spain — Cuenca |
409 |
0.763 |
0.865 |
0.859 |
0.872 |
Uzbekistan — Tashkent |
156 |
0.730 |
0.844 |
0.905 |
0.791 |
Spain — Rus |
249 |
0.617 |
0.763 |
0.699 |
0.841 |
Argentina — La Banda |
93 |
0.576 |
0.731 |
0.653 |
0.829 |
Global (mean of 8 AOIs) |
2819 |
0.744 |
0.850 |
0.837 |
0.868 |
Area-based IoU / F1 / Precision / Recall measured against ground-truth vegetation masks; evaluation run 2026-07-03. Compared with the previous version v.2025-06-14 (mean F1 0.513, IoU 0.396).
See also
📊 See per-location benchmark details for the area-by-area breakdown, including comparison with the previous version and prediction-vs-ground-truth overlays.
🚗 Roads
Model for road segmentation in high resolution imagery (0.3 - 0.5 m)
The model is trained primarily for rural and suburban areas. Multi-task learning is applied in order to improve the road mask connectivity, especially in the spots obscured by trees or buildings. Best suited for areas with low urbanization, and can fail in cities where wide roads with sidewalks and complex crossroads are present. We extract the road central line in order to decrease the clutter and optimize the extracted road network, and then the road lines are inflated back to polygonal object.
In version 1.1 we added the road graph postprocessing:
geometry simplification;
merging of the gaps;
removal of double edges;
removal of detached and too short segments;
Processing results samples
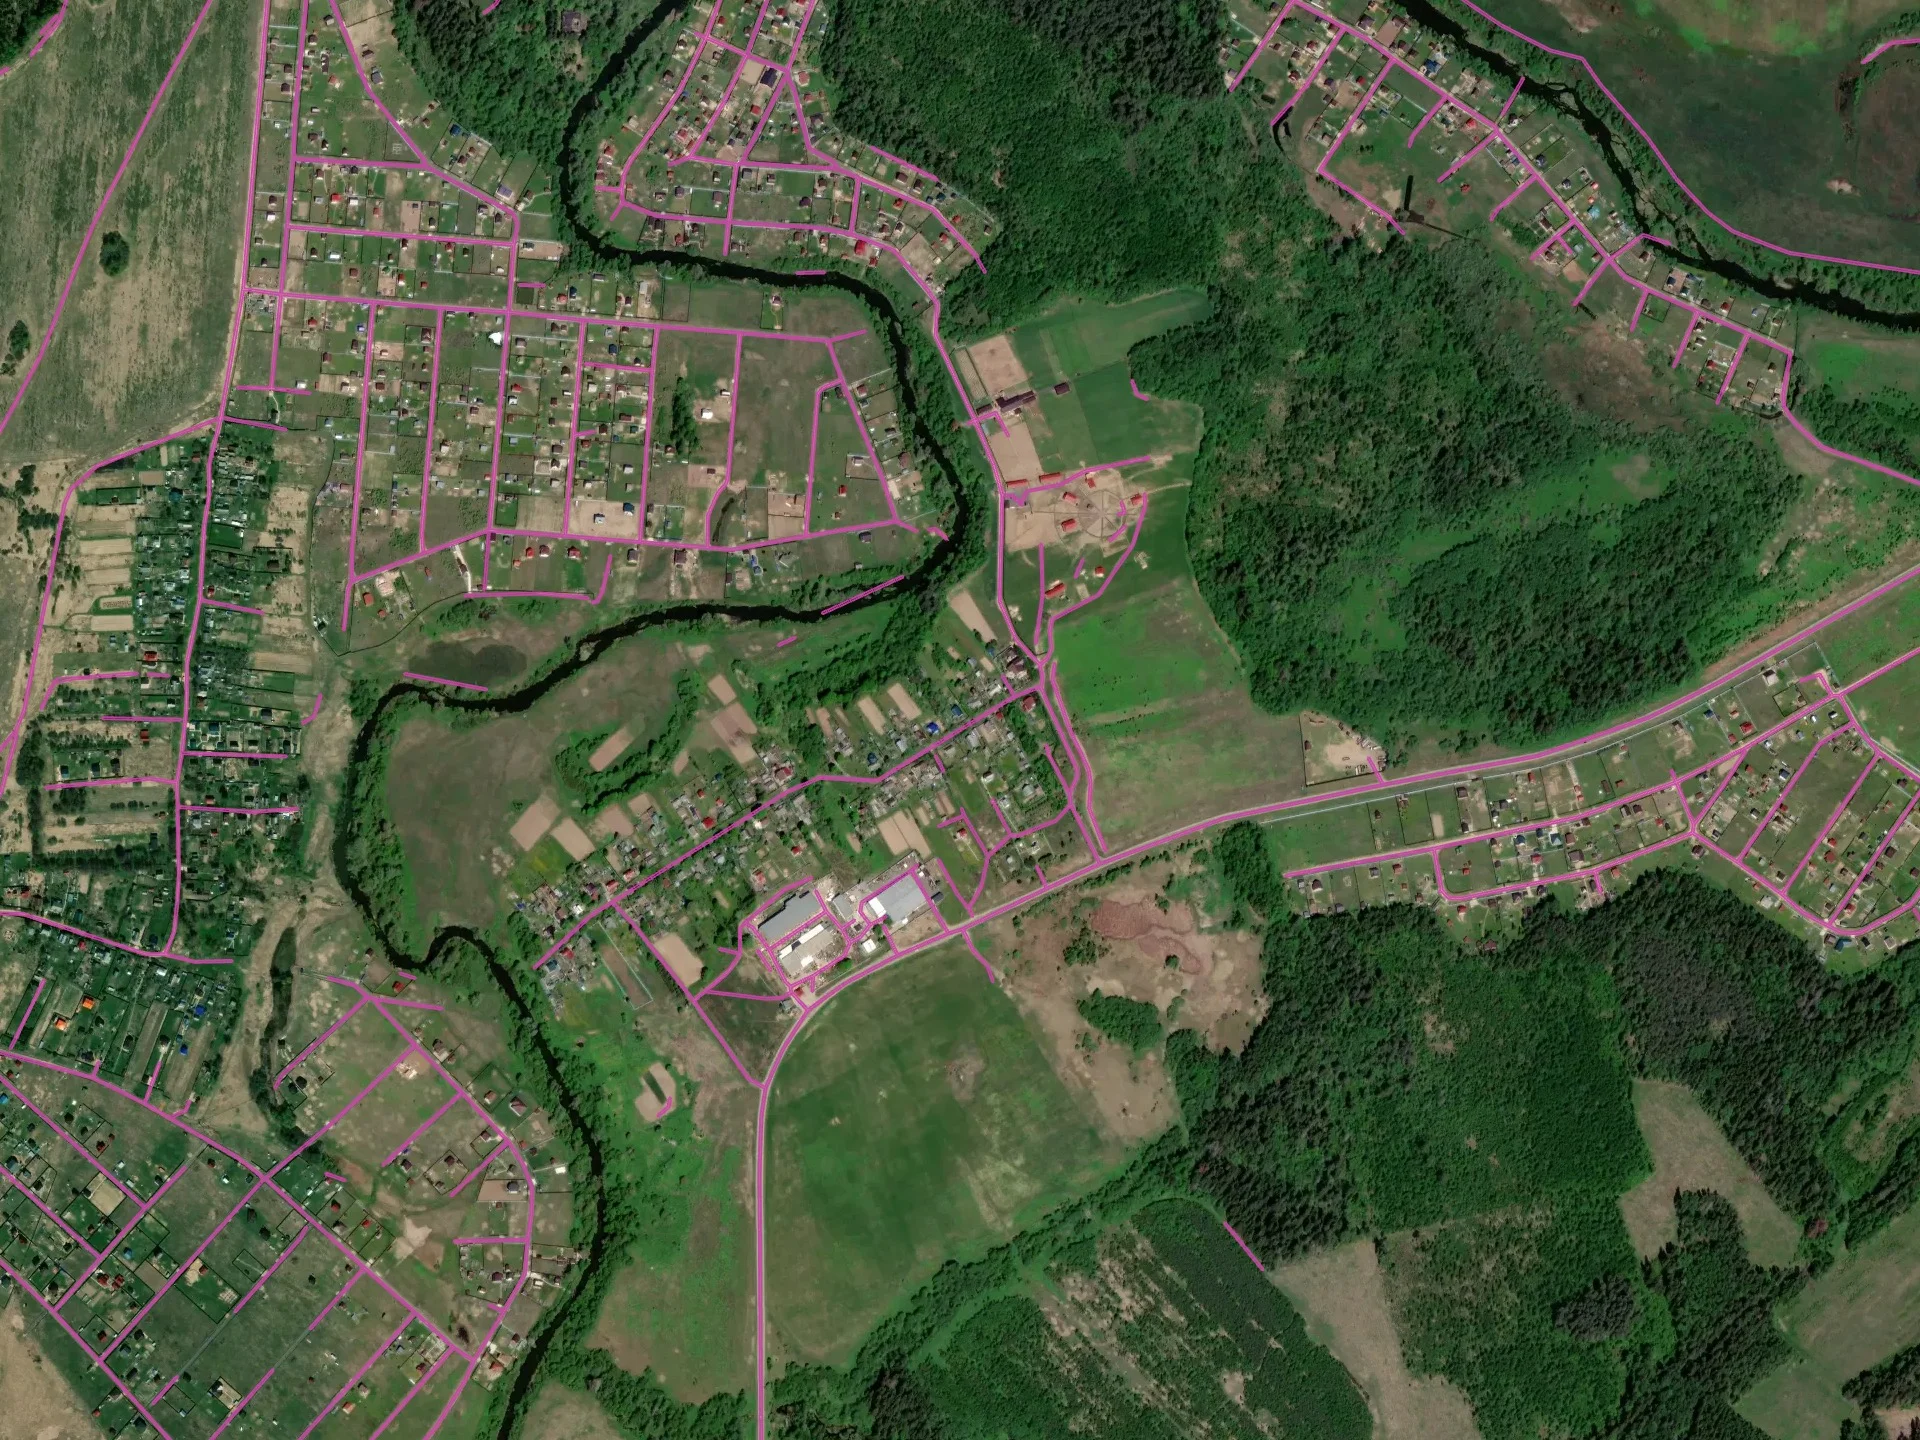
Optimal conditions for the model: rural/suburban territory, Russia
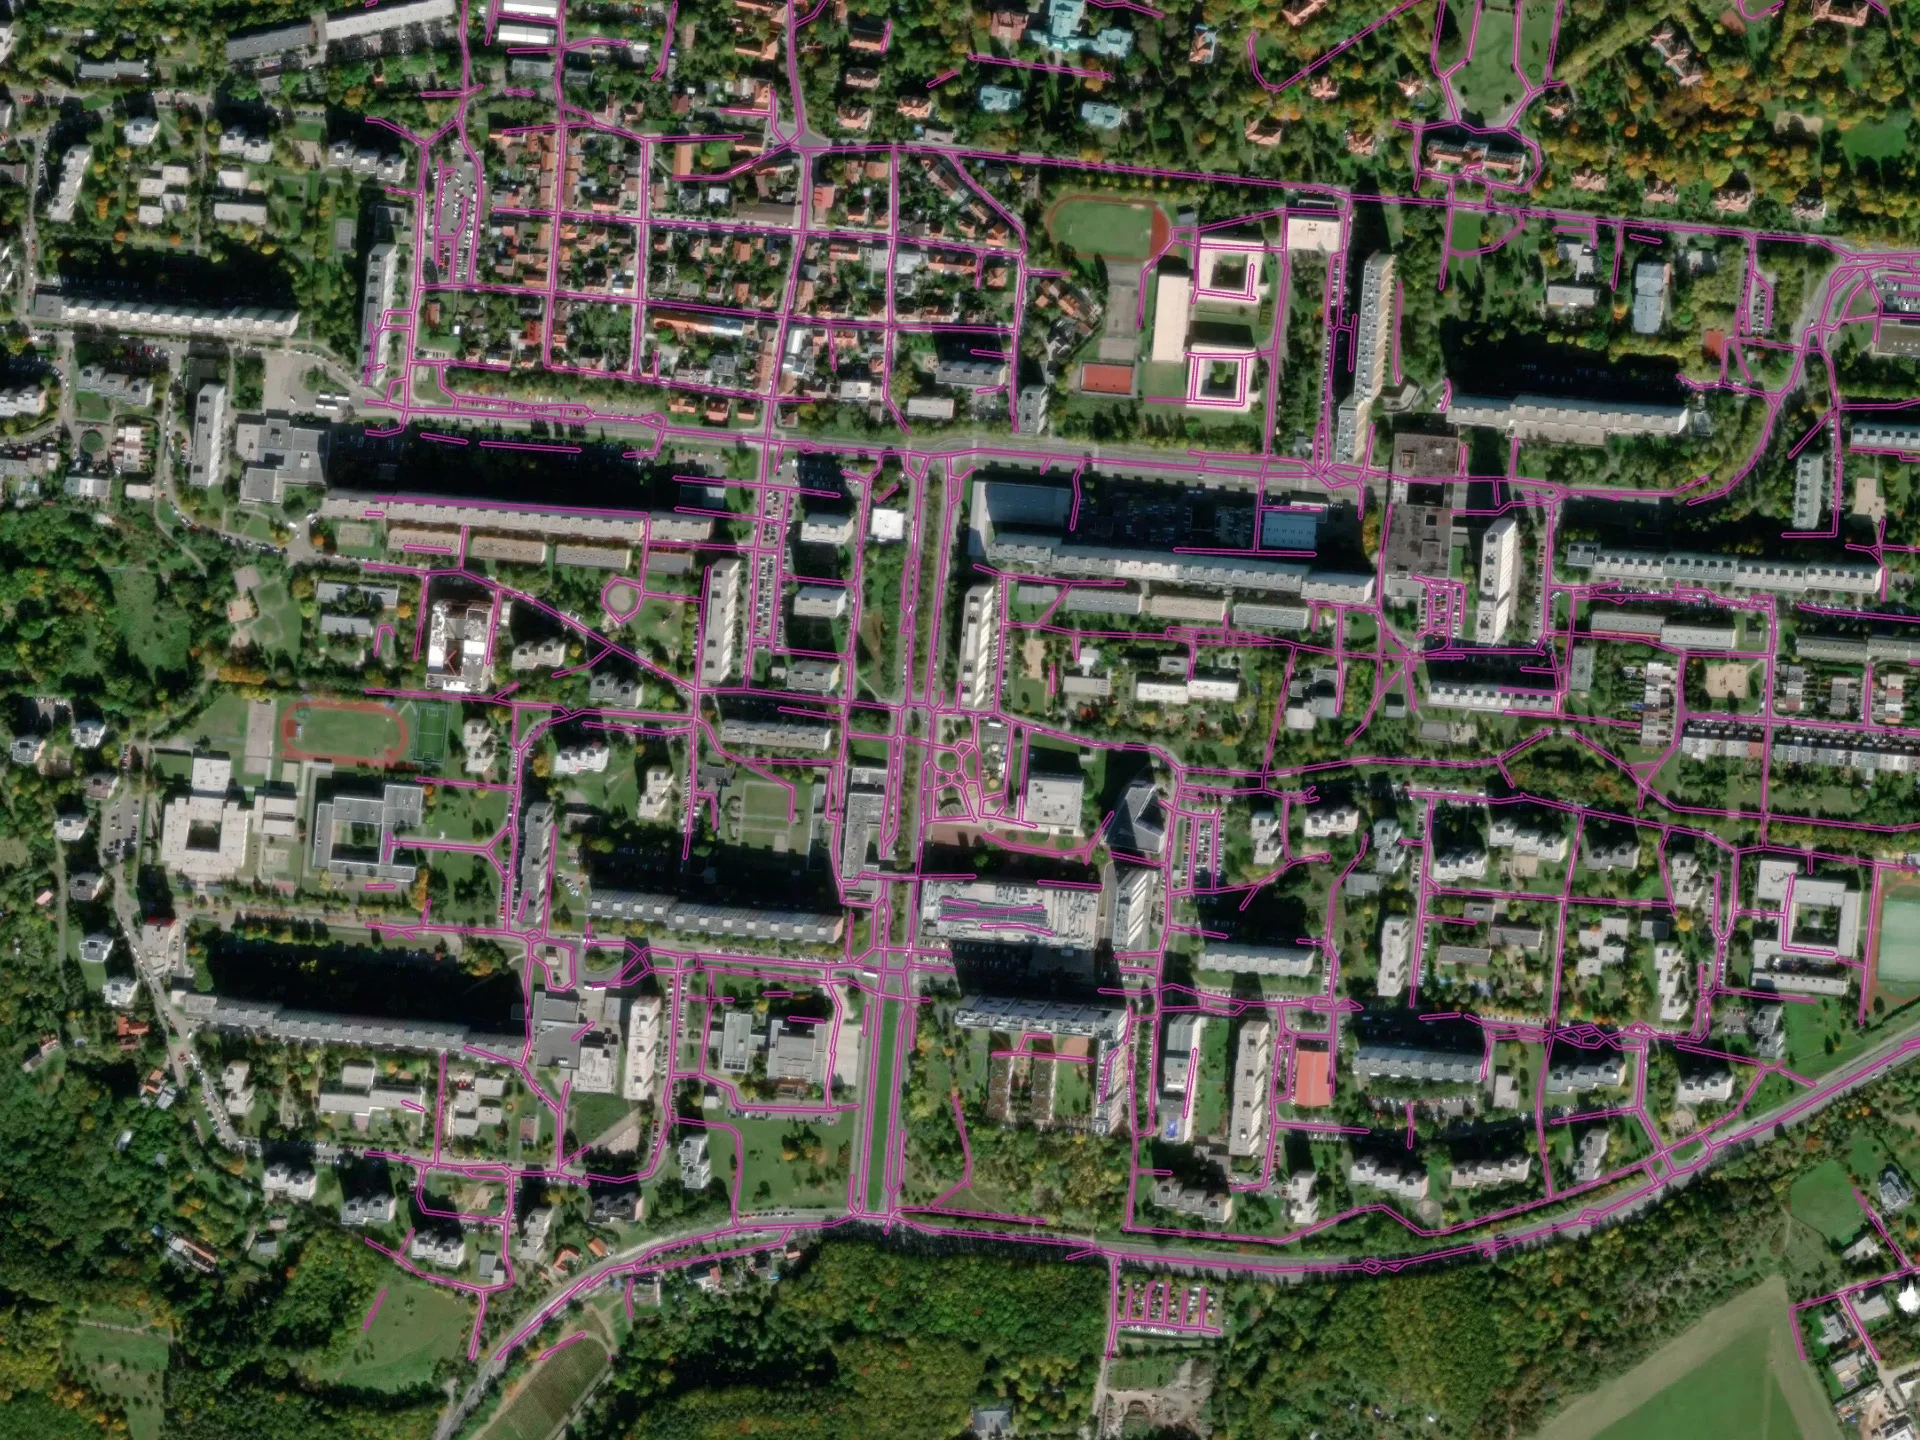
More complex environment - urban territory in Prague, Czech Republic
[multi] Buildings + Roads + Forest
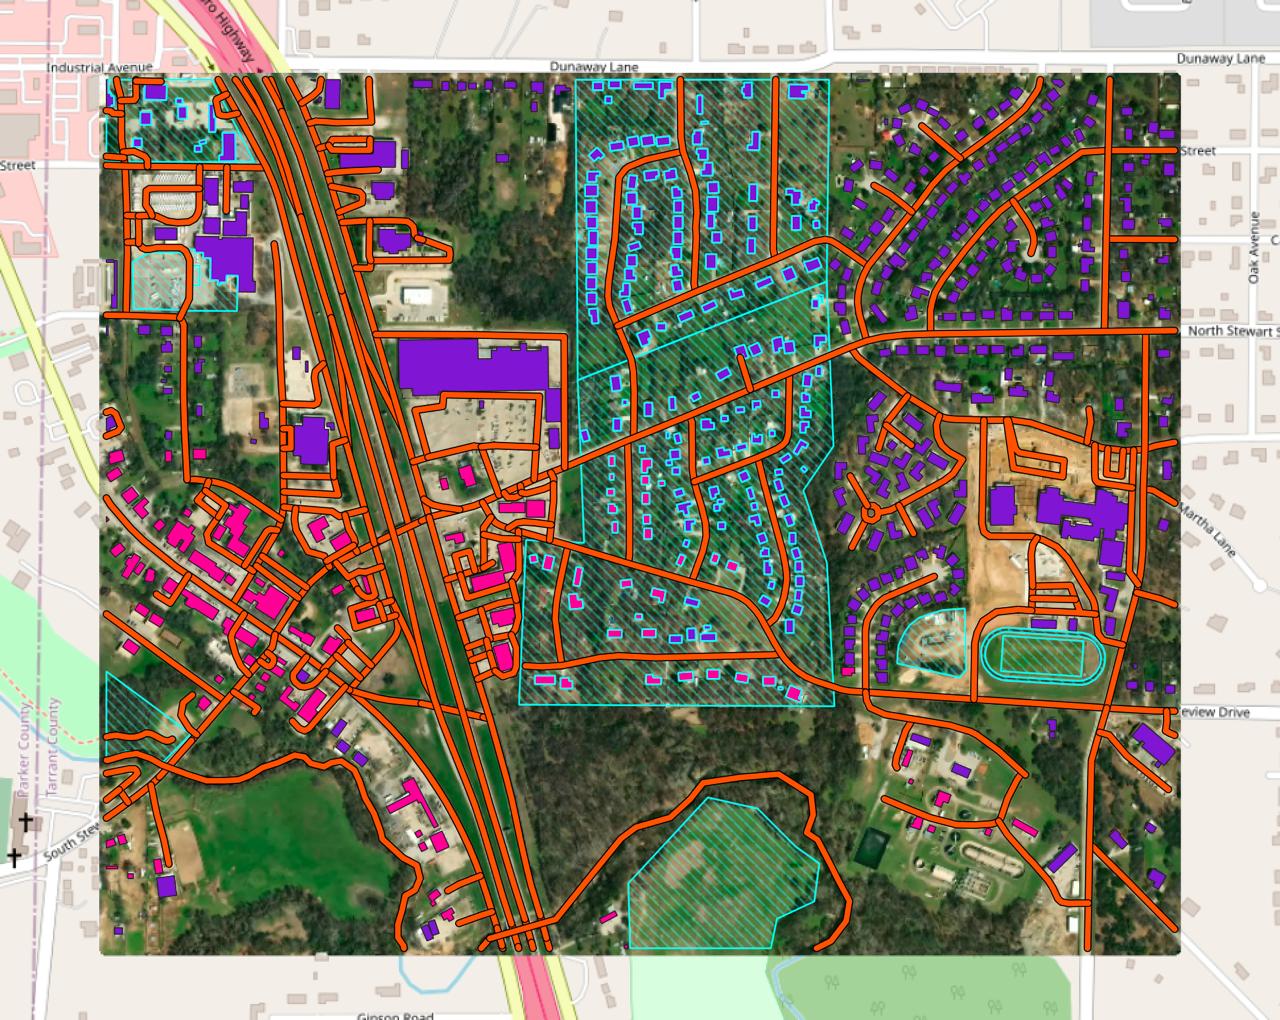
This pipeline combines Buildings, Forest and Roads in a single workflow and returns the topology-corrected GeoJSON output.
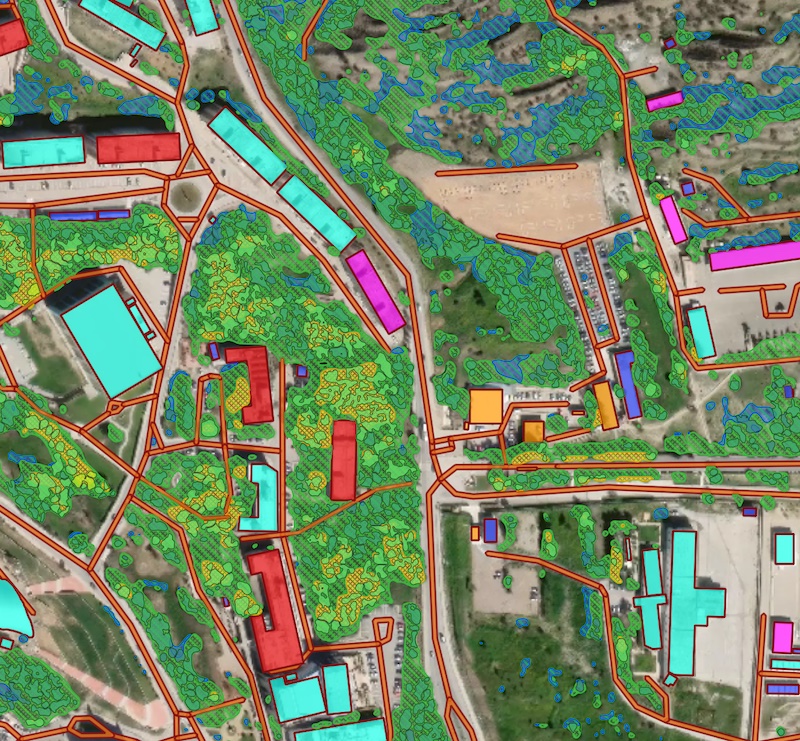
Processing result sample for a combined scenario featuring Buidlings, Roads and Forest models.
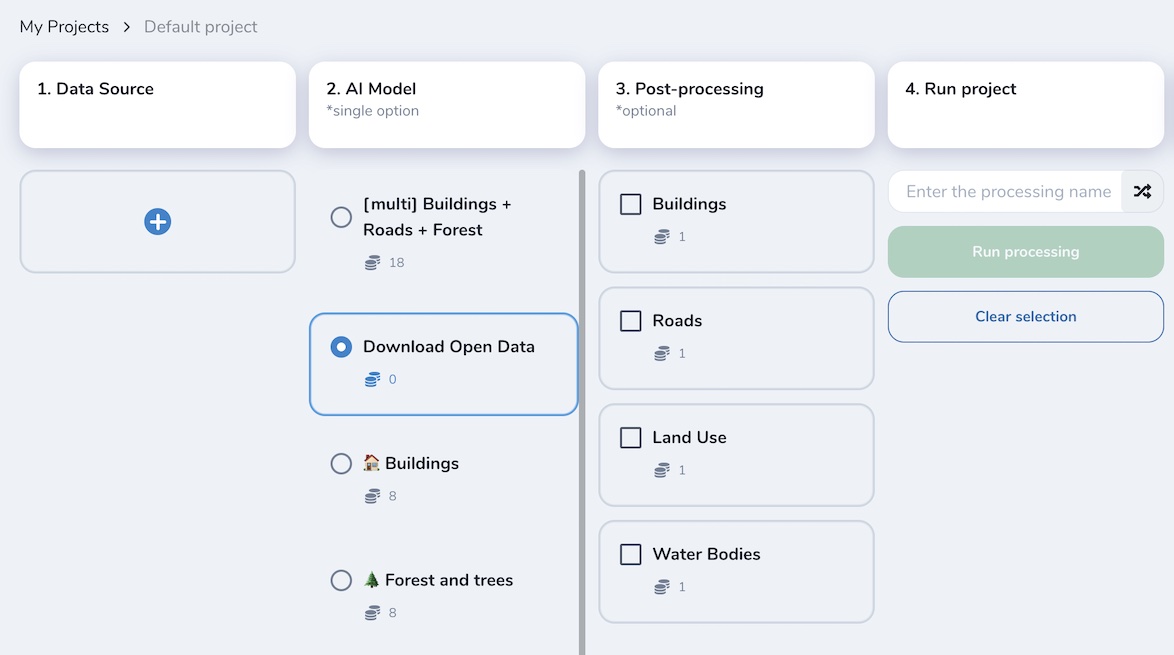
Download Open Data
In Mapflow, you can download open mapping data from OpenStreetMap and Overture Maps. This pipeline does not use any AI model. It is designed to support your mapping projects with community-maintained open data.
Select one or more semantic classes and run the workflow.
Run the pipeline
Get the results and the image preview (in Web app or QGIS project)
Warning
Results depend on the availability and completeness of open mapping data in your area of interest. You can use it alongside AI-mapping results as a complementary source.
Note
You have to select an image source the same way as for AI-mapping pipelines. Note that the results may not be well aligned with the image, because the data comes from an external open data source. The image is provided only for visual reference, so you can decide whether you need to apply edits or run a Mapflow model to complement the results.
Custom Models
There are several options of model customization in Mapflow.
You request access to a specific model based on your use case and data, and we train it for you and connect it to Mapflow.
You choose one of the pre-trained models that are not included in the standard Mapflow pipelines and test it with your data or on your area to decide if it’s applicable or requires additional training.
You train your own model with custom data and request our support to connect it to your account to leverage your model with the Mapflow workflow engine.
Below is the list of custom models created for specific use cases and available in Mapflow by request (to be updated).
🏗️ Constructions (CUSTOM)
This model outlines the areas in the satellite image that contain construction sites and buildings under construction. The current model dataset is limited to some countries and the work of extending it is in progress.
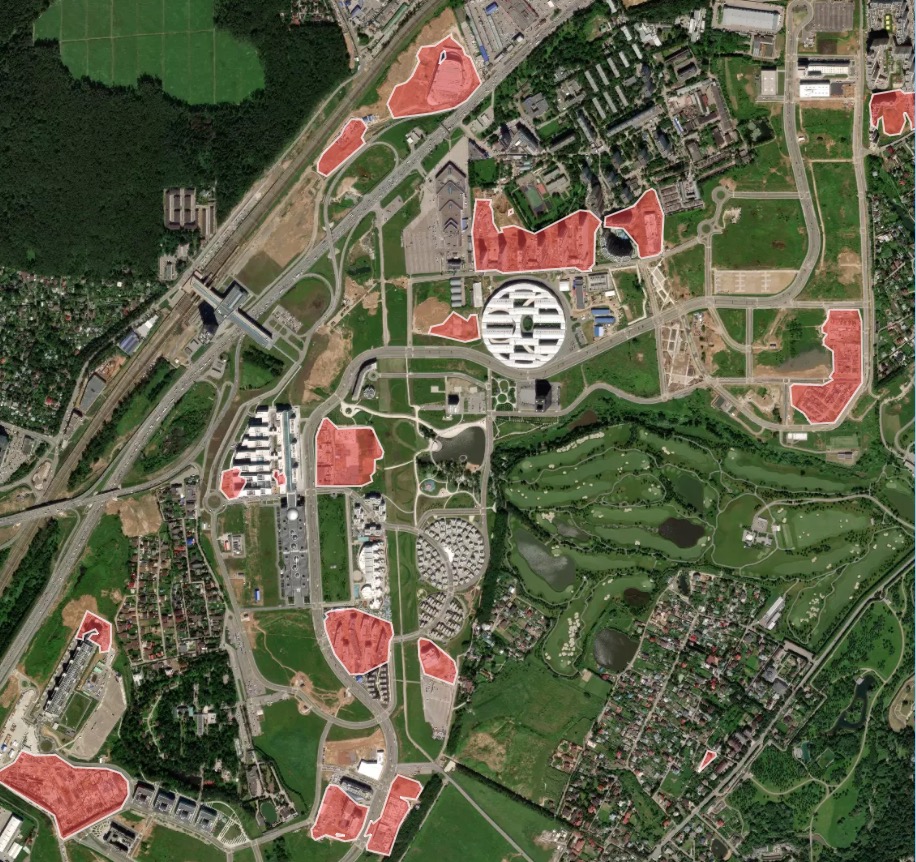
Processing result sample for a rapidly developing area with construction sites
🏘 High-density housing (CUSTOM)
Note
This model has been deprecated as default one and moved to custom. it’s available only by request.
The “high-density housing” AI model is designed for areas with terraced or otherwise densely built buildings, common in the Middle East, parts of Africa, etc. This model, just like the regular building model, detects the building roofs. Firstly, the building blocks are segmented as a whole, and then each block is attempted to be devided into individual houses based on the detection of individual roof markers with rectangular grid or Voronoi diagram.
Processing result sample for dense urban development area (Tunisia, Africa):
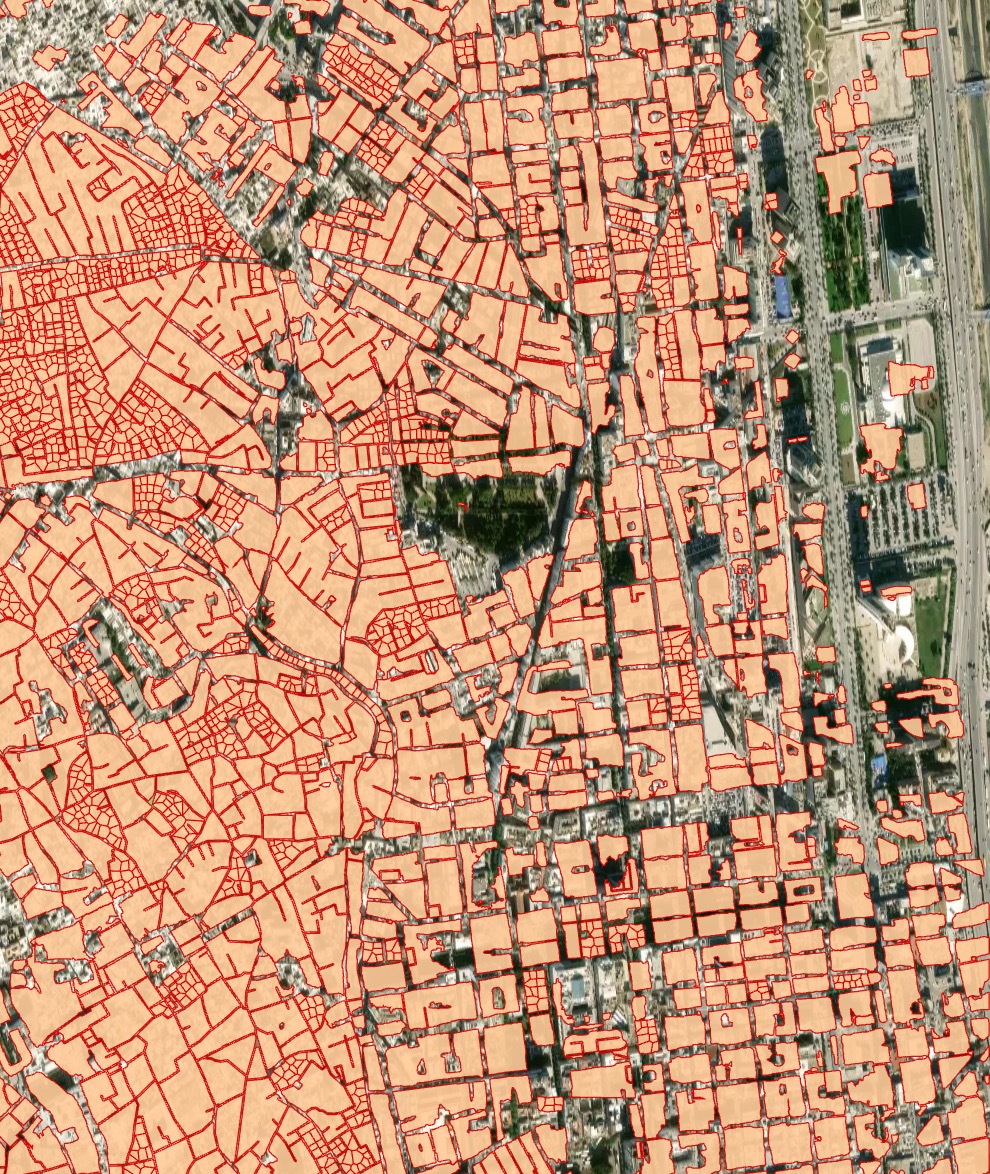
High-density buildings model, instance segmentation and post-processing with grid options
🚜 Agriculture fields (CUSTOM)
Warning
This model has been deprecated as default one and moved to custom. it’s available by request.
Model for fields segmentation allows to detect the agricultural fields and delineate the nearby fields from each other, if there is a visual boundary (forest line, road, different crop stage). The model is trained on the high resolution data (1-1.2 m), primarily for Europe, Russia. It performs better with larger fields with active vegetation. Smaller and terrace fields (typical for Asia) are delineated not so good. Fields without vegetation, especially in winter period, are not target class.
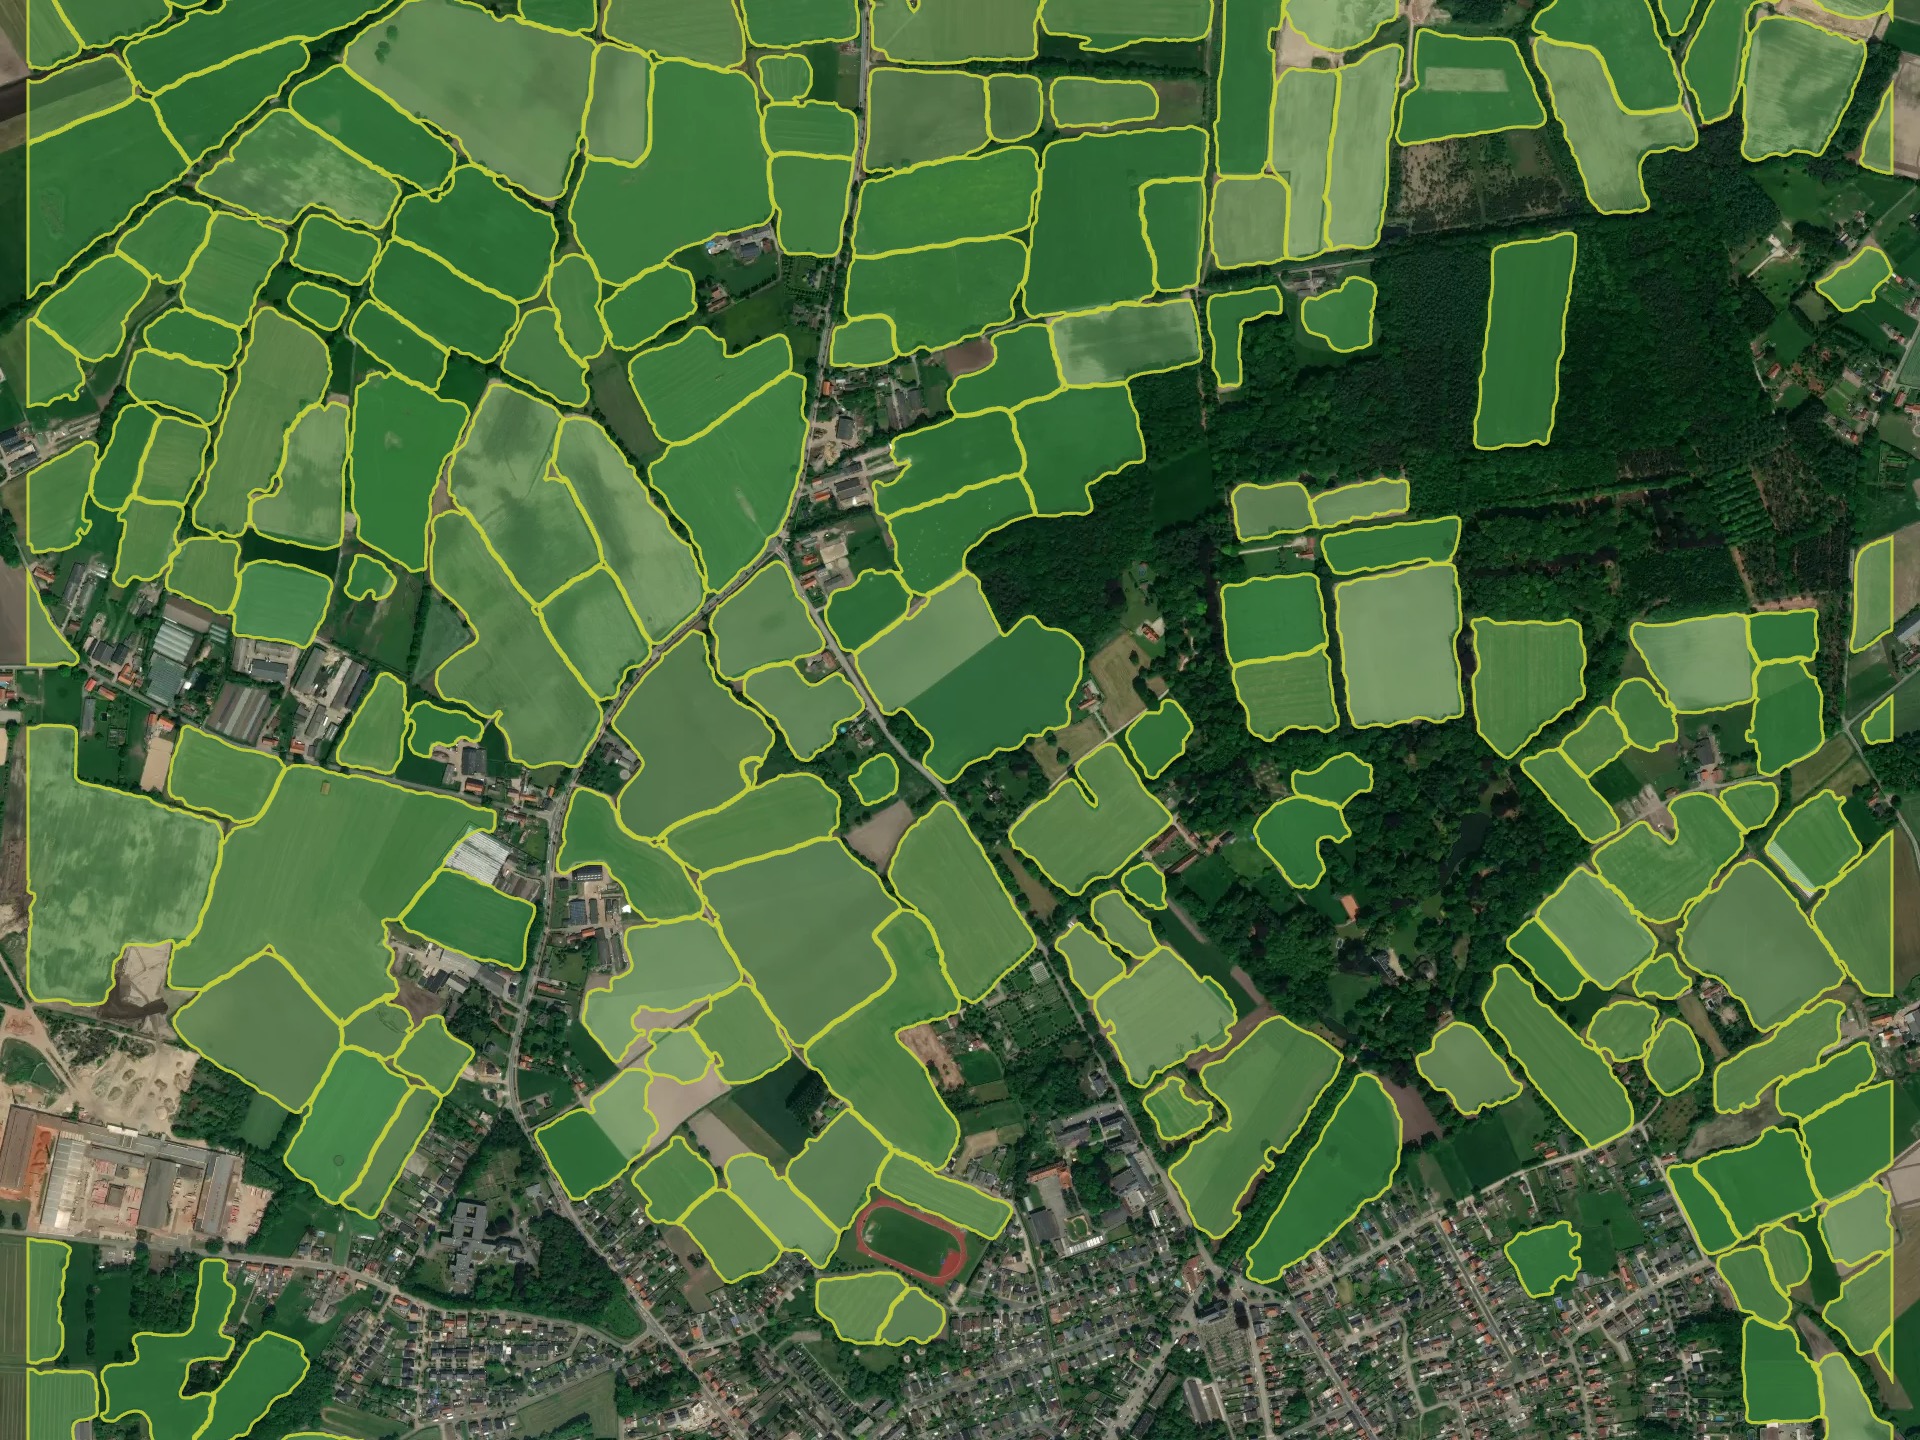
Processing result sample for Europe (Belgium)
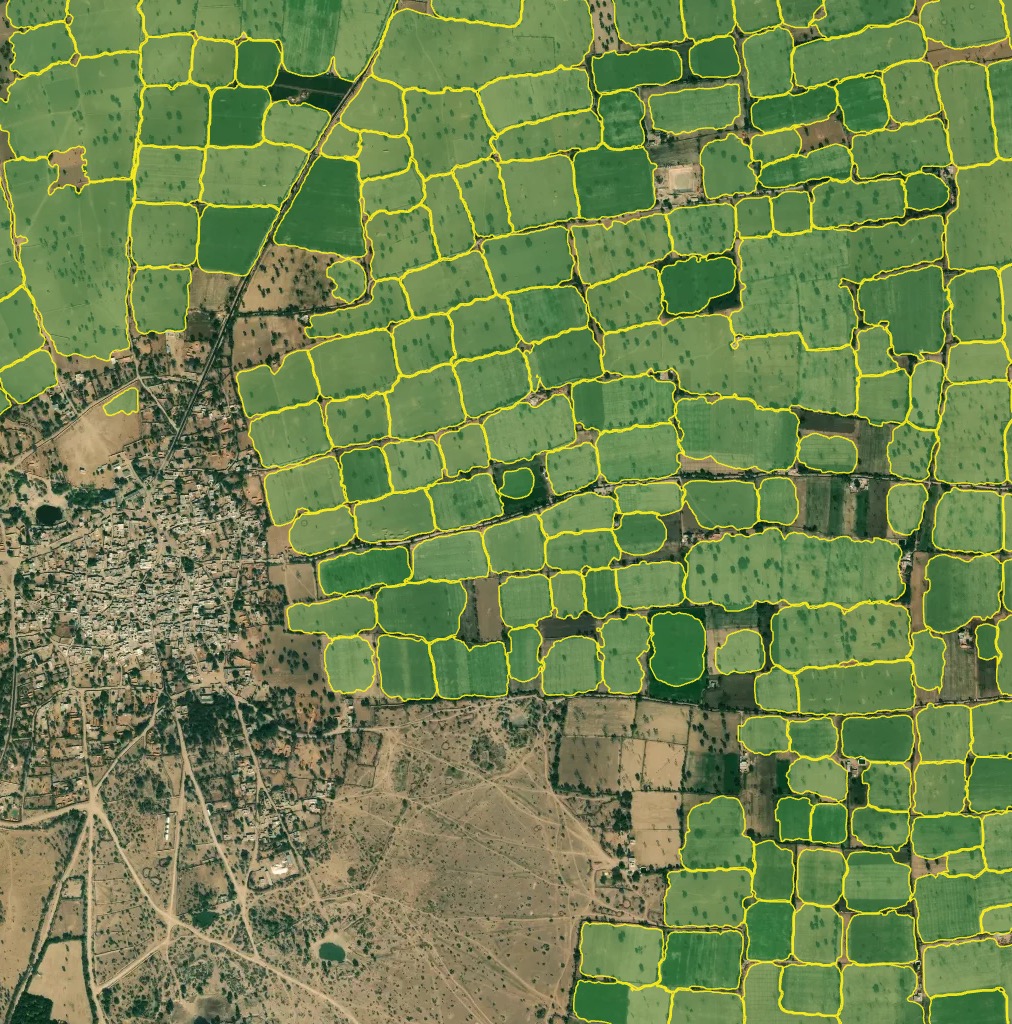
Processing result sample for Asia (Northern India)
✨ Segment Anything v1 (CUSTOM)
Note
This model has been deprecated as default one and moved to custom. it’s available only by request.
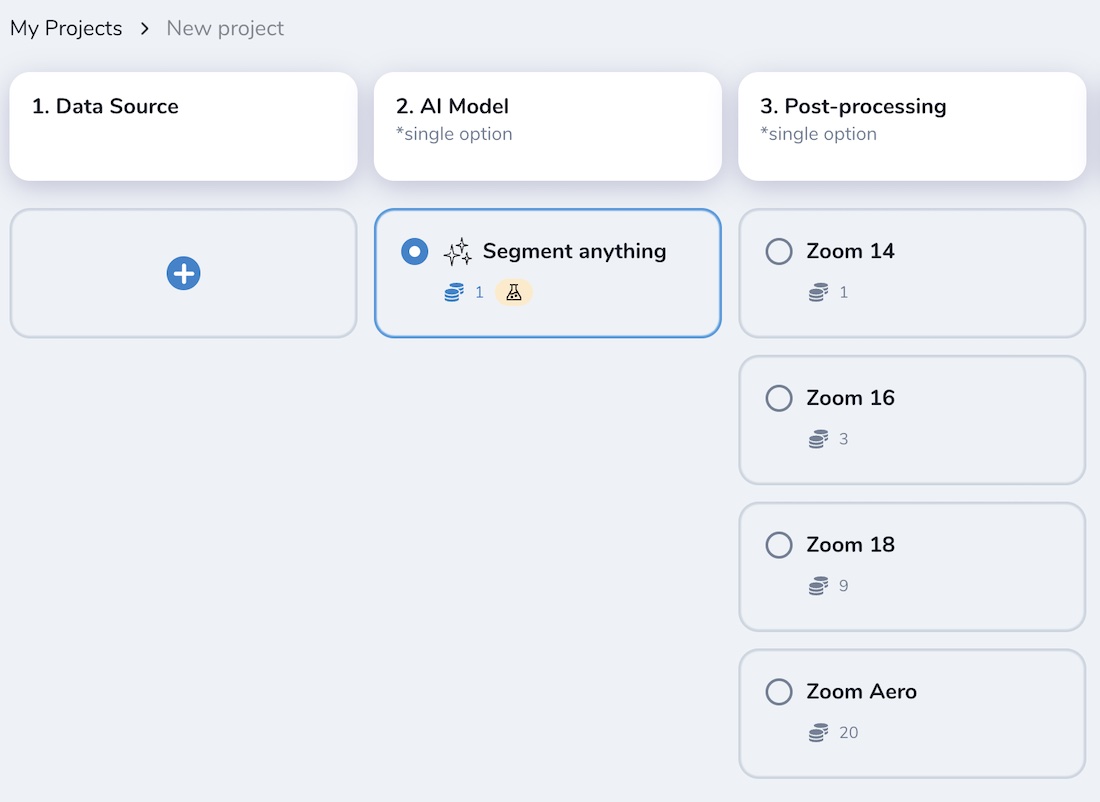
The “Segment Anything” (originaly introduced by Meta as universal segmentation model) is available as yet another experimental model in Mapflow. We adjusted it to Mapflow workflows to be used on a scale. There are the same steps required to launch this model:
Select your data source
Select your geographical area - either polygon, GeoJSON file, or your image extent
Yet there is one difference in the model workflow:
if you run this model using GTIFF file — the original resolution of the image will be used
if you run it via TMS (e.g. Imagery like Mapbox Satellite) — you need to select the Zoom level (image resolution) from the model options which will be used for the input
Depending on the input resolution, the SAM model will interpret and generate different results. It can be empirically classified by mapping classes depending on the zoom levels as follows:
ZOOM LEVELS |
SEMANTIC OBJECTS |
|---|---|
14 |
Land use, large agri fields, forests, parks, fields, bodies of water |
16 |
Small fields, large buildings, lawns, plots |
18 |
Farms, buildings, groups of trees, etc. |
19+ |
Houses, trees, vehicles, roof structures, etc. |
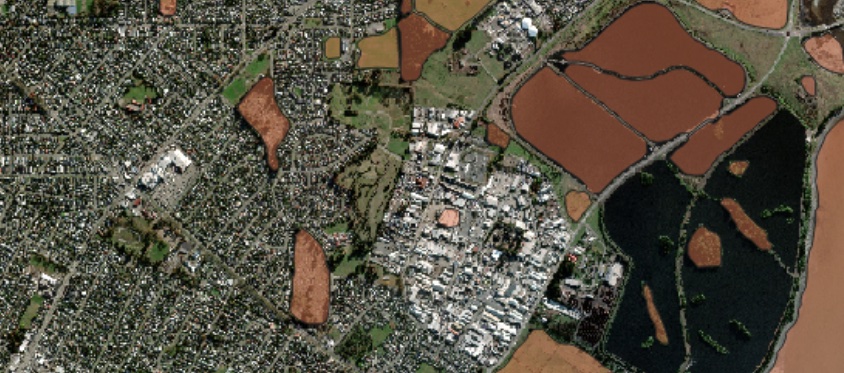
E.g. Result – SAM (zoom 14)
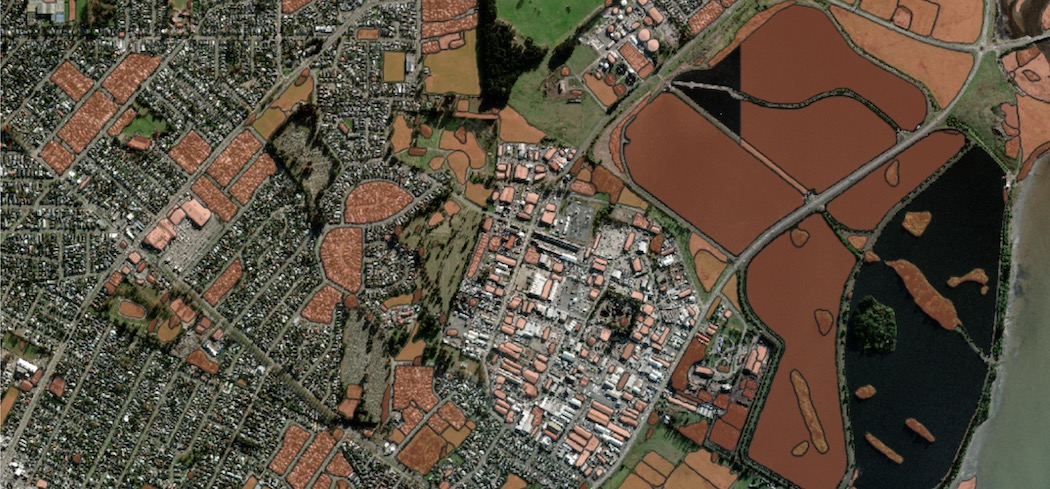
E.g. Result – SAM (zoom 16)
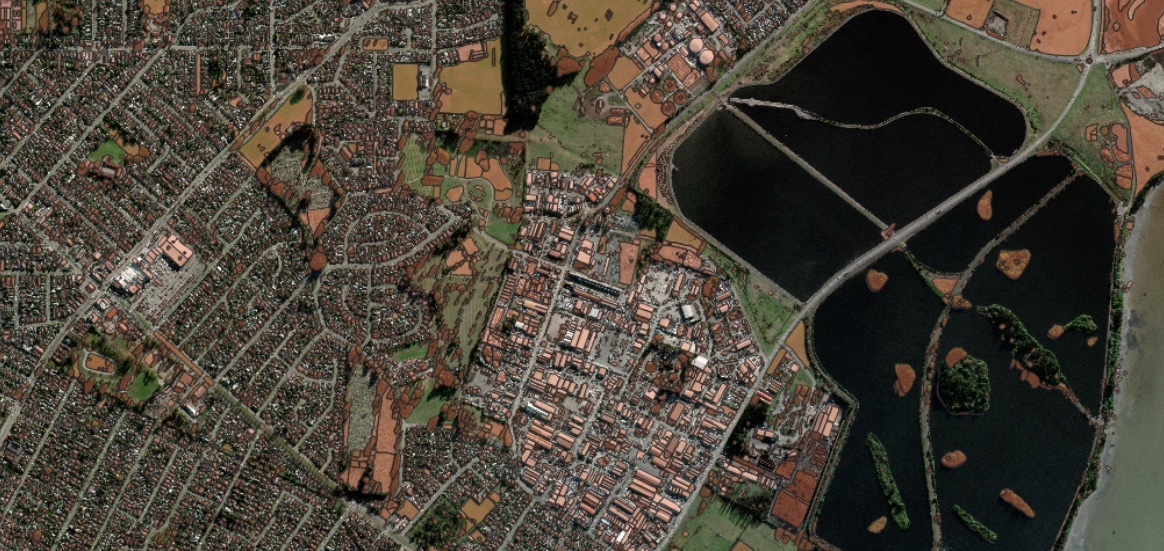
E.g. Result – SAM (zoom 18)
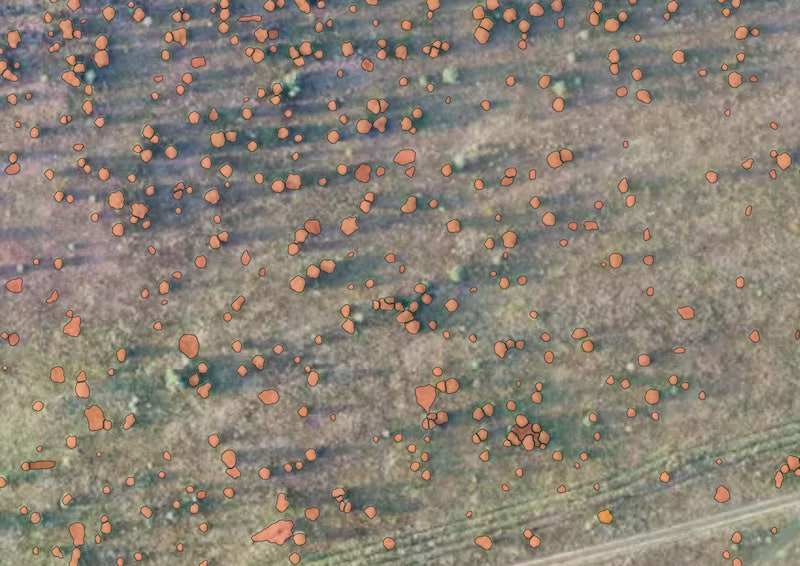
E.g. Result – SAM on aerial imagery (zoom 20), single trees. Some polygons are not very accurate and some target objects are missing, but the overall result is relevant and can be used for more accurate mapping.
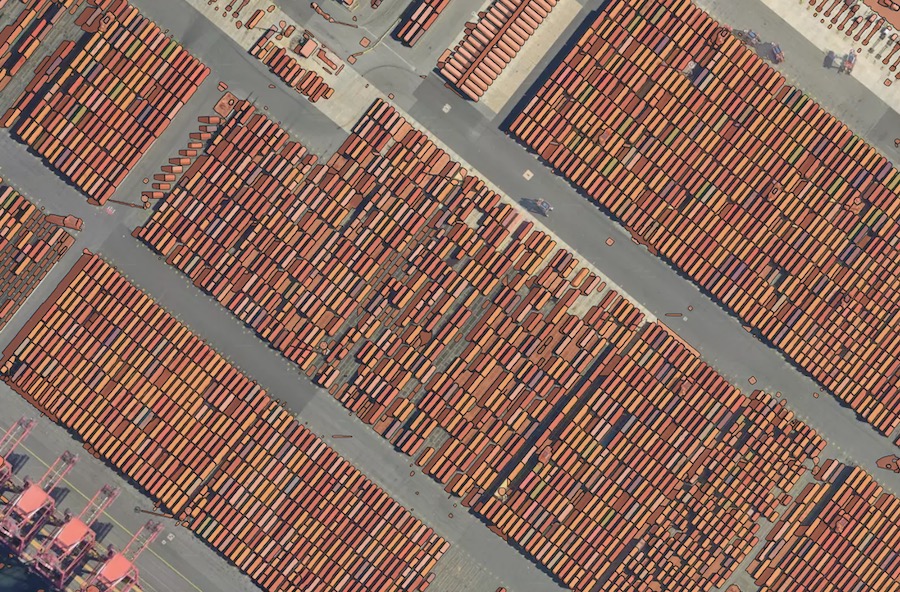
E.g. Result – SAM on aerial imagery (zoom 20), containers. Applicable to small similar-pattern objects, requires some manual filtering of the model’s output.
Note
❗️ SAM is not provided in Mapfow for QGIS list of default models, as the zoom options are not enabled in the current plugin’s design. Yet if you work in QGIS and want to try SAM there — send us a request and we will connect corresponding workflow scenarios with all zoom options specified.
Swimming pools (CUSTOM)
Note
This model is available by request.
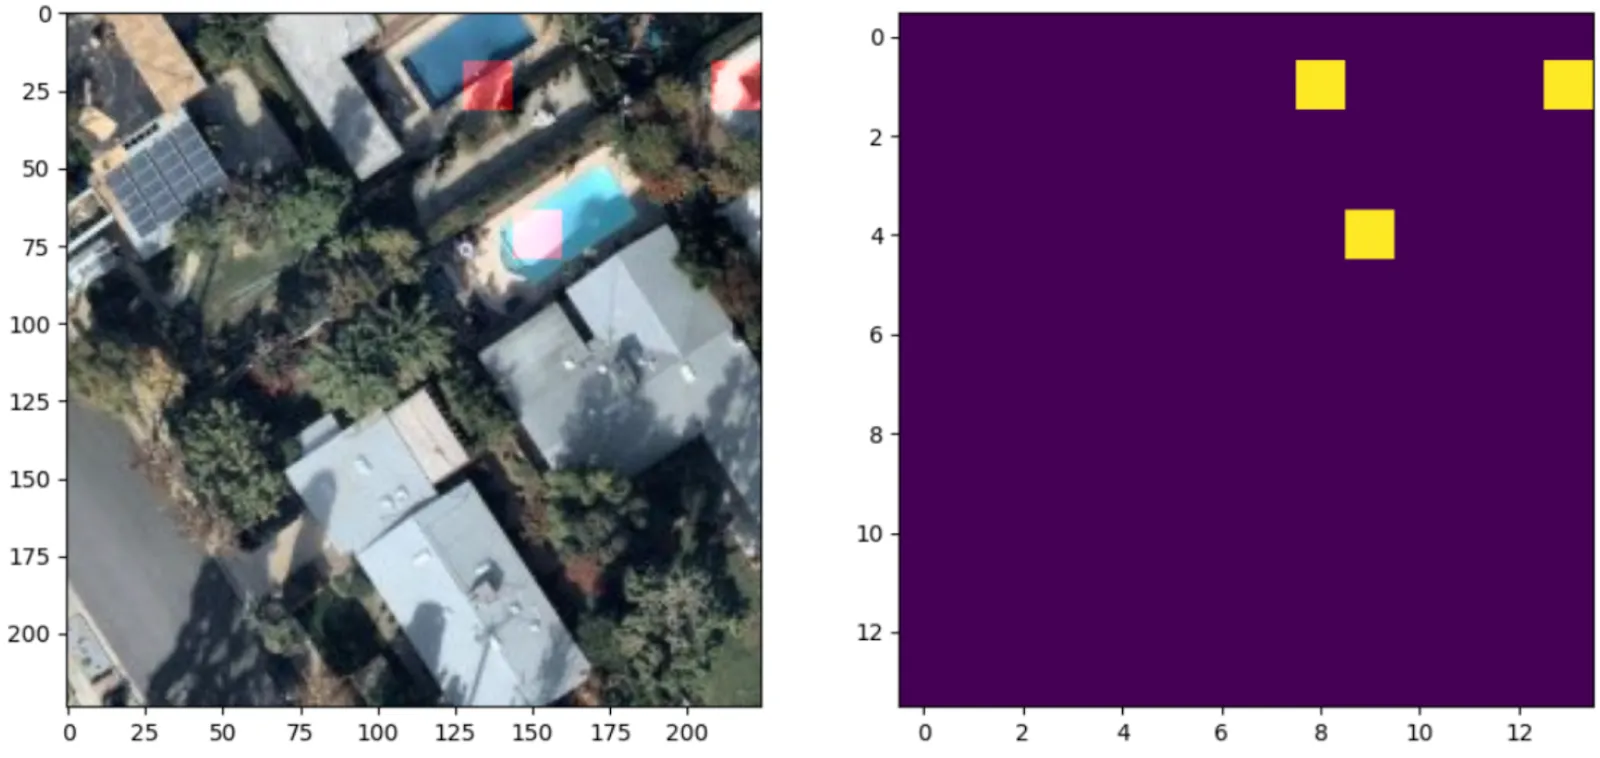
Swimming pools detection and classification. The model is trained on the high resolution aerial imagery (working zoom level 19). The testing benchmark score is F1 > 0.95.
Model name |
Model type |
Zoom level |
F1 (testing) |
Geo domain |
|---|---|---|---|---|
Swimming pools |
Detector + classification |
zoom 19-20 |
> 0.95 |
Global |
Read more about the use cases and the model application
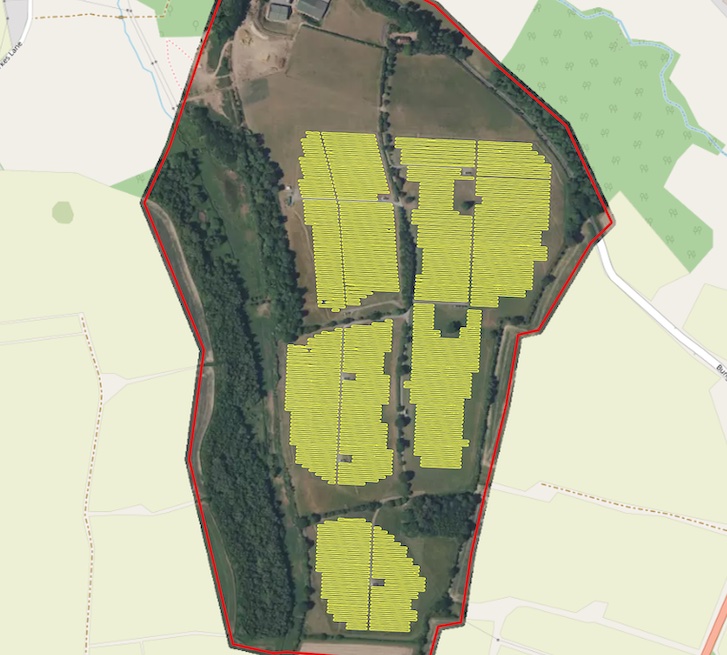
☀️ Solar panels (CUSTOM)
Note
This model is available by request.
Solar panels is a model trained for detecton of Photovoltaic elements using aerial imagery (working zoom levels 19-21). It’s capable of detection PV elements both on the rooftops and on the ground. The testing benchmark score is F1 > 0.87.
Model name |
Model type |
Zoom level |
F1 (testing) |
Geo domain |
|---|---|---|---|---|
Solar panels |
Detector + segmentator |
zoom 19-21 |
pixelwise > 0.77 |
Global |