QGIS (qgis.org) is the leading and most popular Open Source Desktop GIS. Users can visualize, manage, edit, analyse geodata, and compose printable maps. Get a first impression with a more detailed feature list.
Know more about QGIS and istall it from official site.
QGIS has an interface for external Python plugins that allows to connect more apps and extend core functionallity. Our “Mapflow - QGIS” app enables connection to Mapflow Mapflow Processing API to run AI-mapping and add output as layers to the QGIS workspace.
Click Plugins -–> Manage…, go to the Not installed (or All) tab and enter “MapFlow” in the search box. Click Install Plugin. You will be able to see then if the newer version of the app is available (in the Upgradeable tab) and to check the changelog for details.
The plugin icon has appeared in the QGIS Toolbar.
If the icon isn’t automatically displayed, right-click on the Toolbar and check if the Mapflow checkbox is activated.
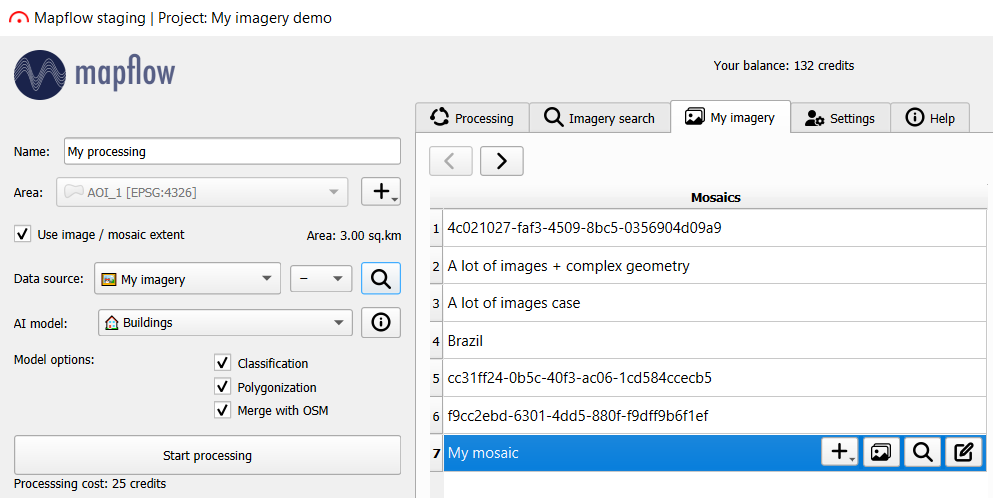
Main plugin workspace has two sections: left sidebar with the processing controls and the tabs section.
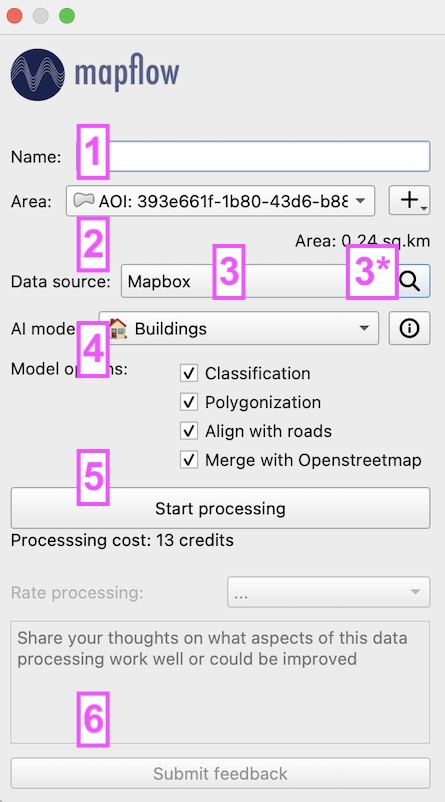
Processing controls panel allows to start new processing and/or rate finished processings, and includes following:
Processing controls panel
# Name of the field / button
Description
1 Processing name
Name of your processing
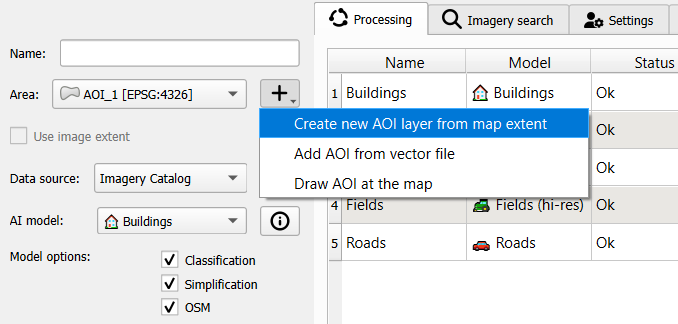
2 Area
The area to be processed. This layer is automatically displayed in the drop-down list from the list of QGIS vector layers.
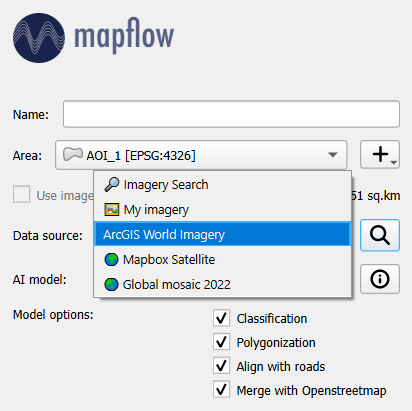
3 Data source
Base imagery to be processed. By default Mapbox is selected, in the drop-down list you can also select satellite images of the commercial providers. You can open your image through the additional options button.
3* Zoom
Selecting the zoom for the Data source used (currently not available in the public version)
3* Show preview
A preview of your data source or, if it is not available, an OpenStreetMap basemap
4 AI Model
Processing type. In the drop-down list, you can select the following processing types (default list of processing scenarios): Building Detection, Roads Detection, Forest Detection, Forest Detection With Heights, Construction Detection, Fields Detection.
4* Your balance
Remaining area available for processing
5 Start processing
New processing start button. You will see a notification about the successful start of processing, or about incorrectly selected parameters after clicking it. It will appear in the block for displaying and working with processing after a successful start of processing.
6 Stars for rating
Rating scores for the finished processing. Feedback field
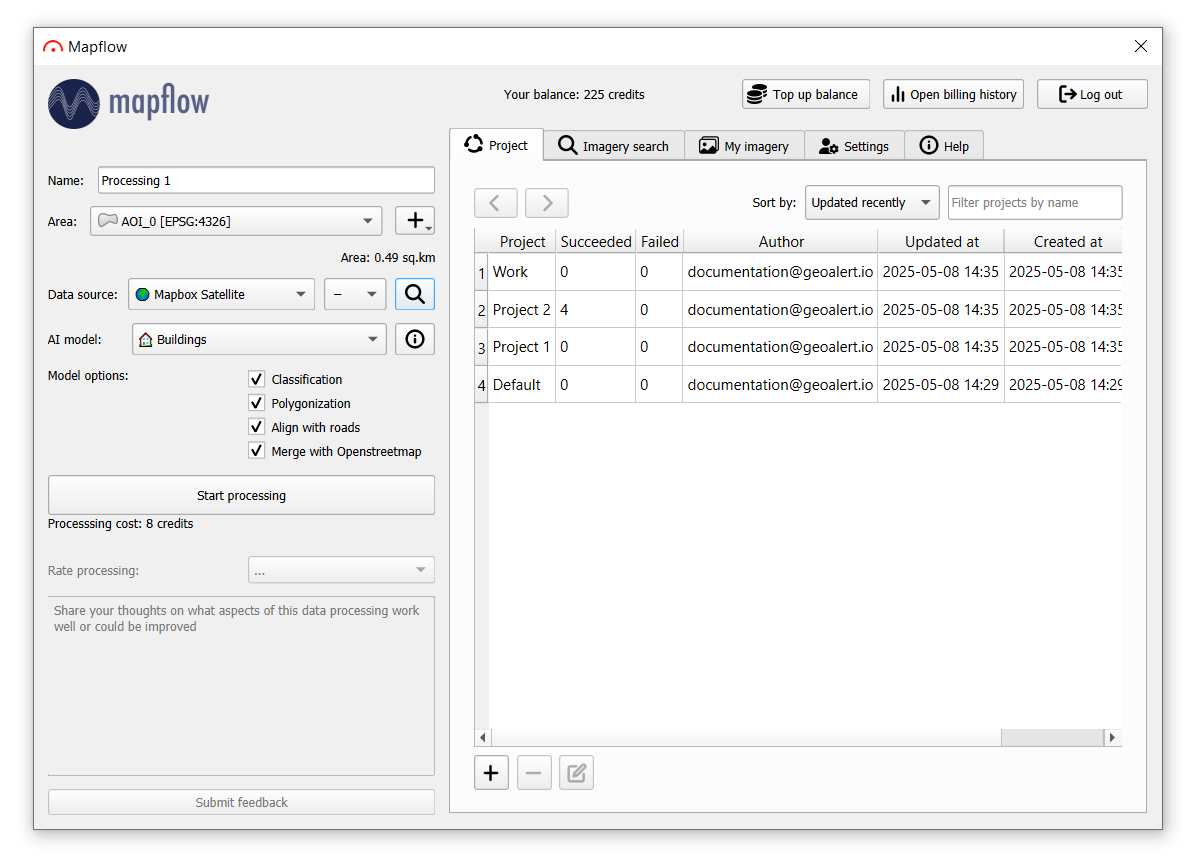
Your current balance is dispayed in the Tob bar. It also contains menu to access you personal profile on Mapflow.ai: top up you balance; open billing history; log out of current session.
This tab is divided into two parts. First, you will see a list of your projects. Here you can create, edit, and delete projects using the buttons at the bottom of the panel. Various sorting options and a search for a project by name are also available.
To go to the processing of the selected project, you need to double-click on it or select the project and click on . To return to the list of projects, click .
Note
Since plugin version 3.3.0, the processing API v2.0 is used.
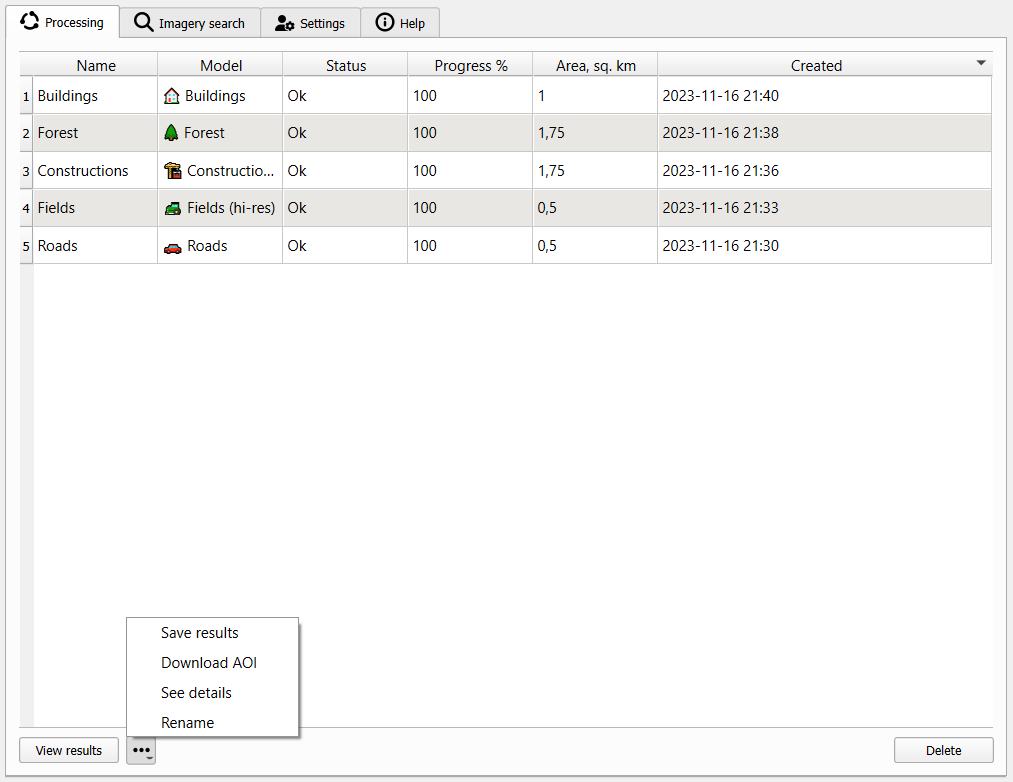
To view the processing results, click on the “View results” button or double-click on the processing name in the table.
You can manage the processings using the options and buttons in the bottom panel menu (Delete, Rename, Save results, etc.). Processing filter by name is available at the top of the panel.
Just like in Mapflow WEB, you can duplicate the selected processing and run a copy of it with the same parameters via “Duplicate” buttonThe duplicated processing will have a new unique ID, but the name will be the same as the original one. You can rename it using the “Rename” button.
Warning
If the processing fails, you can restart it using the “Restart” button after the issue is supposed to be resolved (The button is displayed in the menu only if the selected processing is in a FAILED status).
Hint
⬇️ To download the processing results, you can double-click on the completed processing in the list.
Hint
⬇️ By default the processing results are downloadable as vector tiles for faster preview. To download the processing results as a file you have to choose this option: Settings – “save results as a local vector file”
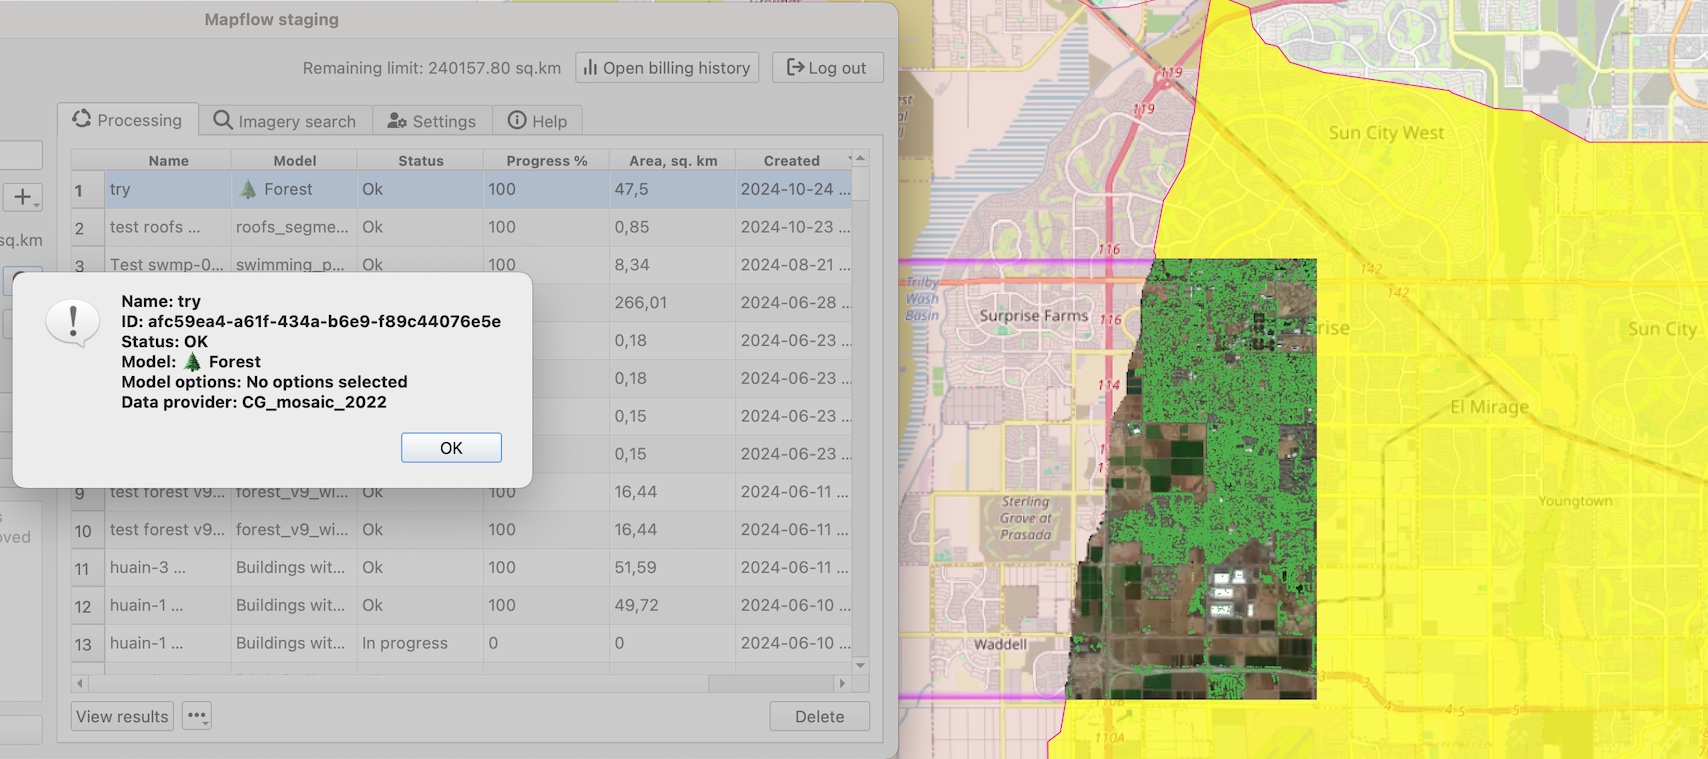
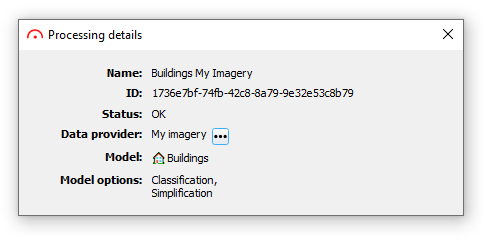
To view detailed information about a processing, click “See details”. The window that opens will display the processing’s Name, ID and Status, as well as the Data provider, Model and Model options used.
In some cases, a button will appear next to the Data provider. You can use it to go directly to the data source, for example, to a “My imagery” collections or a specific image.
Imagery search provides the ability to preview search results with a double-click on a row in a table. You cannot open previews of certain specific parts of some data sources (e.g. ArcGIS World Imagery), but you can enable preview of the entire source! To do this, select the desired provider in the left control panel and click the “Preview” button .
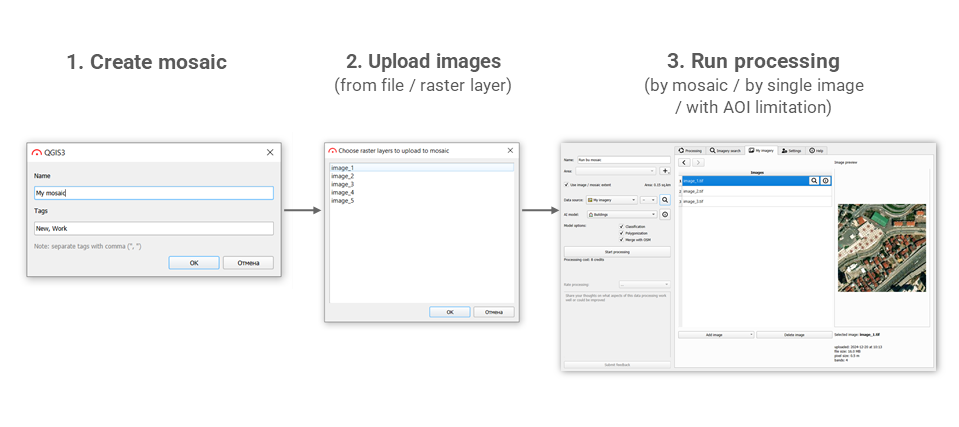
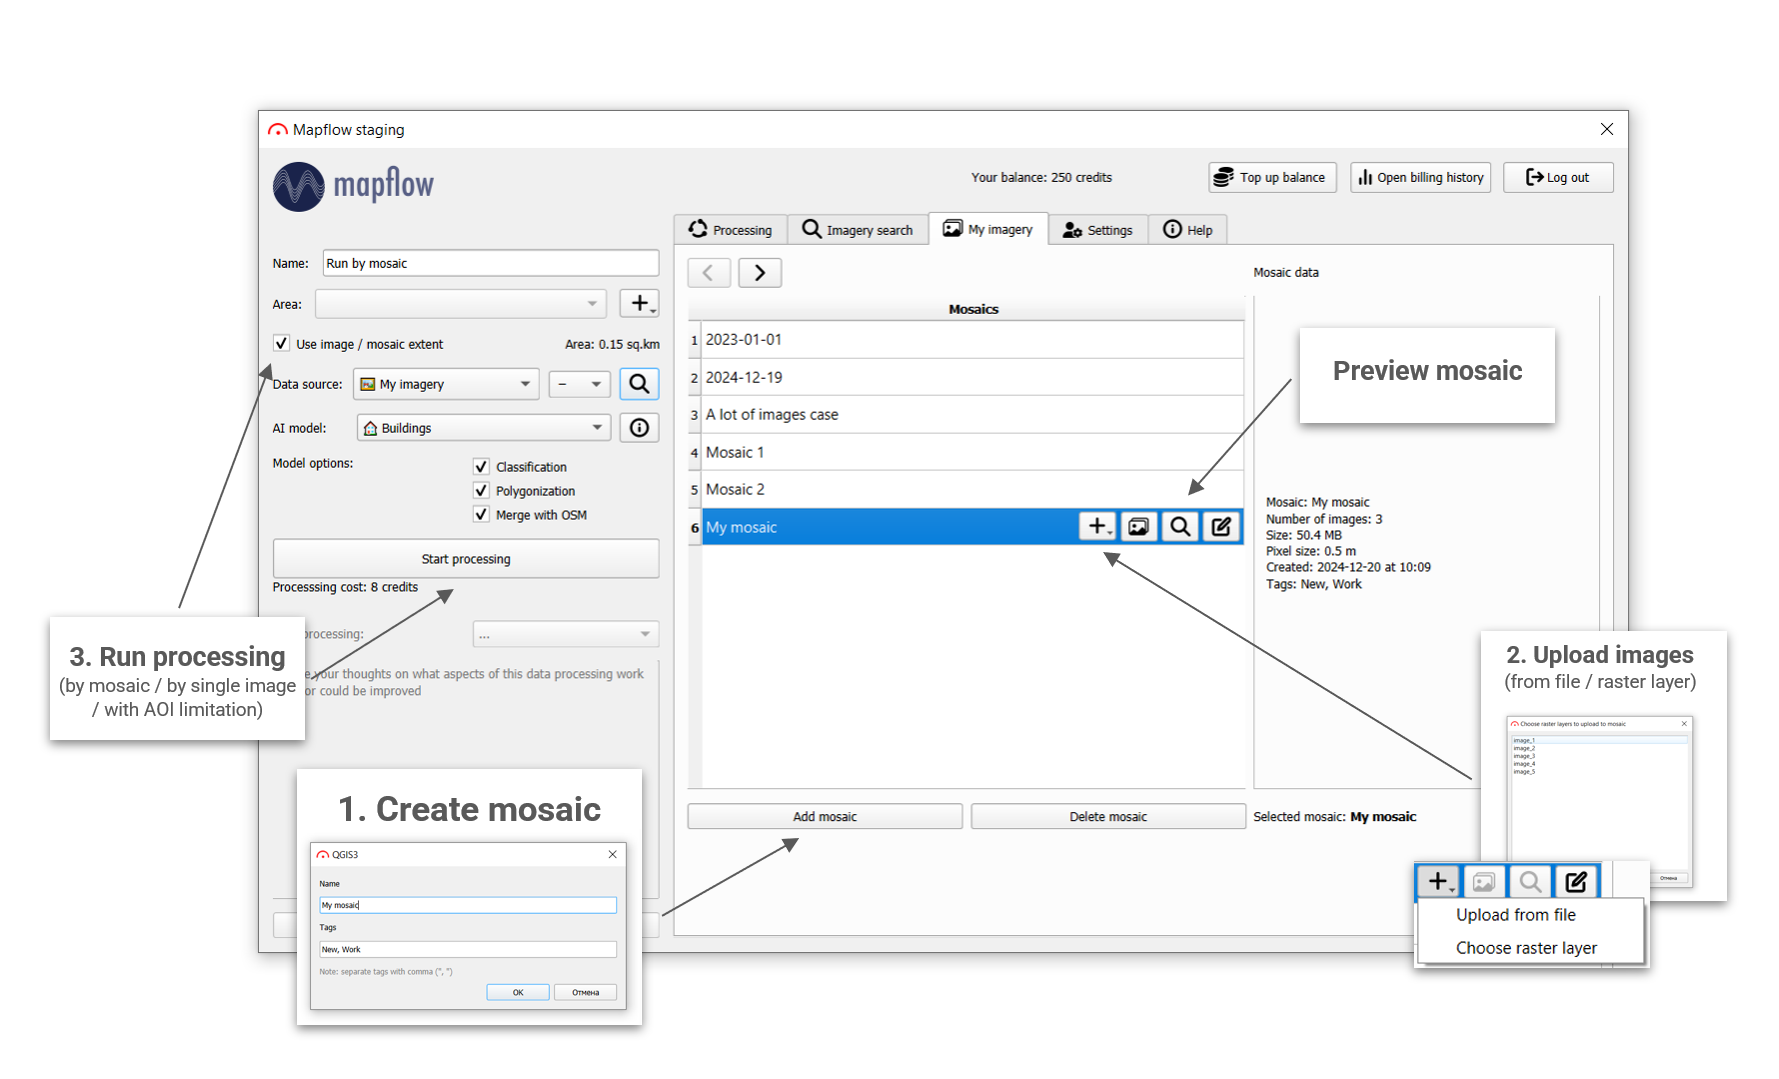
Create the Imagery collection by clicking “Add collection” (You can upload your image to it instantly or do it in the next step.);
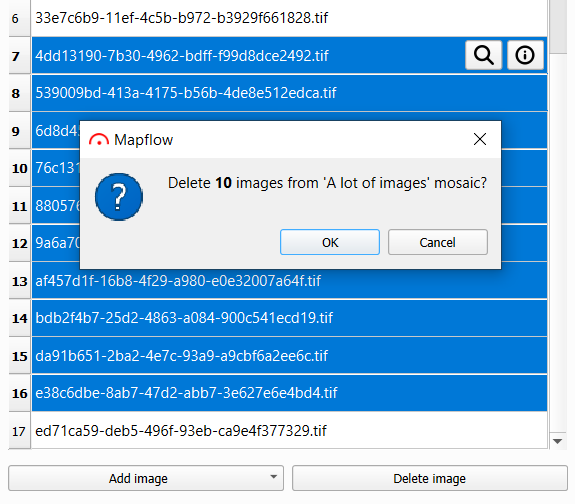
Upload your images into collection, click “+” on selected collection and choose the way of uploading - you can choose from the file on your device or from QGIS raster layer;
Now you can preview the whole Imagery collection (QGIS tile layer will be added);
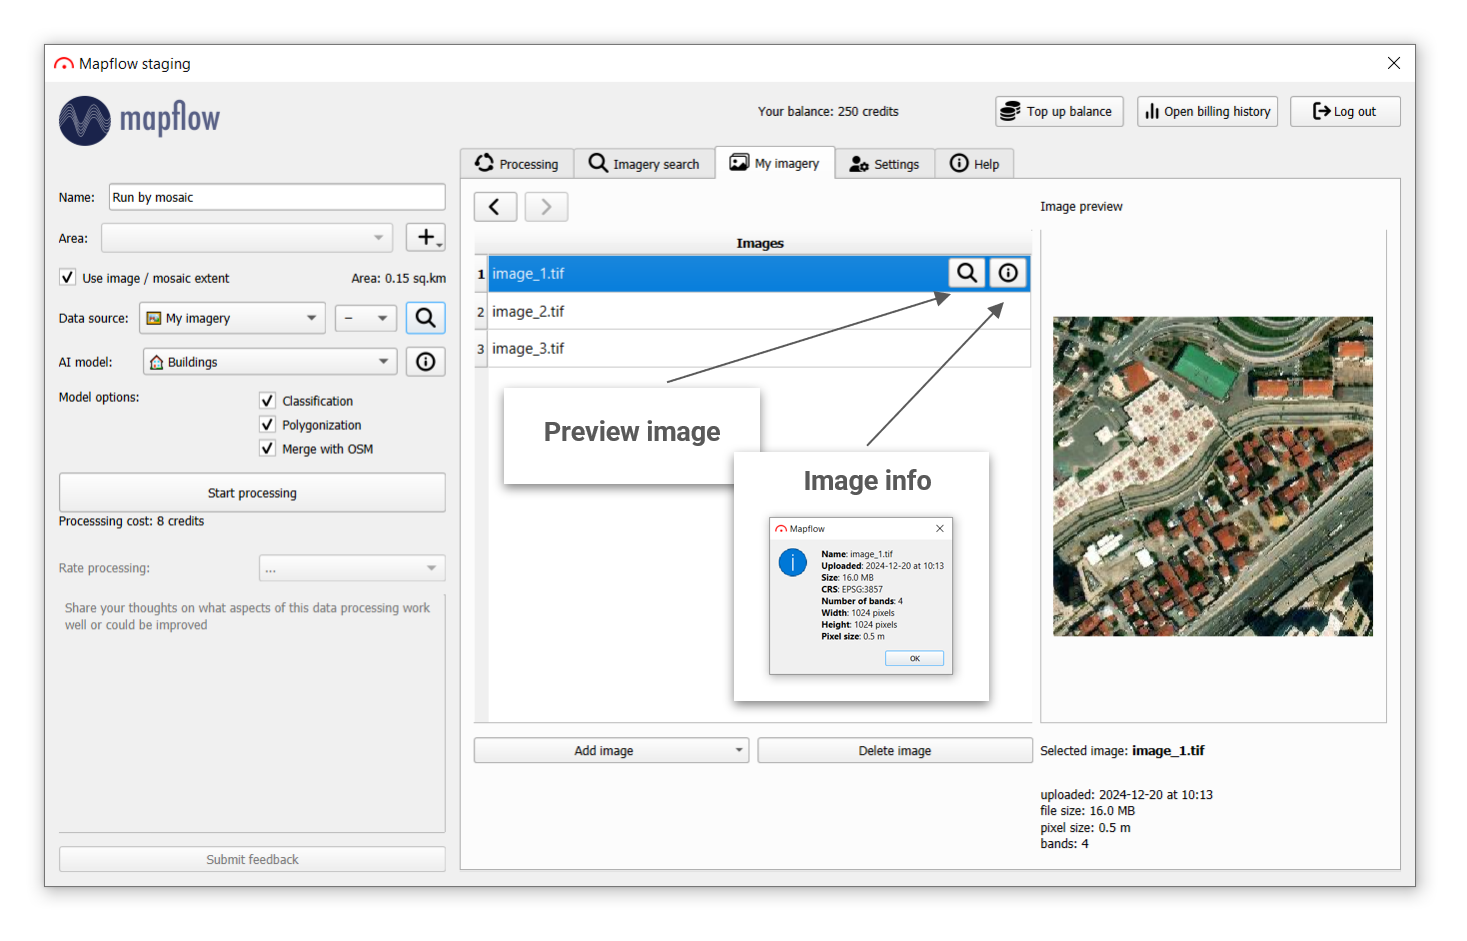
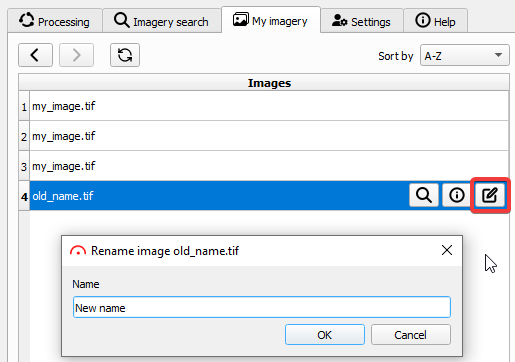
See the uploaded images and preview them one at a time (QGIS tile layer will be added):
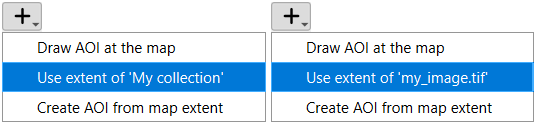
To run the processing, select the collection or a single image you need. Choose custom AOI or collection/image extent through the “+” button;
Note
Selecting Collection or Image extent as a processing AOI:
This tab allows you to manage many of the plugin’s components:
Add, edit, and delete data sources;
Configure columns in Processing and Imagery search tables;
Сonfigure how the processing results will be uploaded to QGIS;
There are two ways:
viewresultasavectorlayer - This is streaming vector tiles directly from our server, which allows you to view results of the processings without downloading full results file, so it will be faster for big processings.
savelocalgpkgfiletoviewresults - Saving local gpkg files on your disk for further loading as QGIS layers.
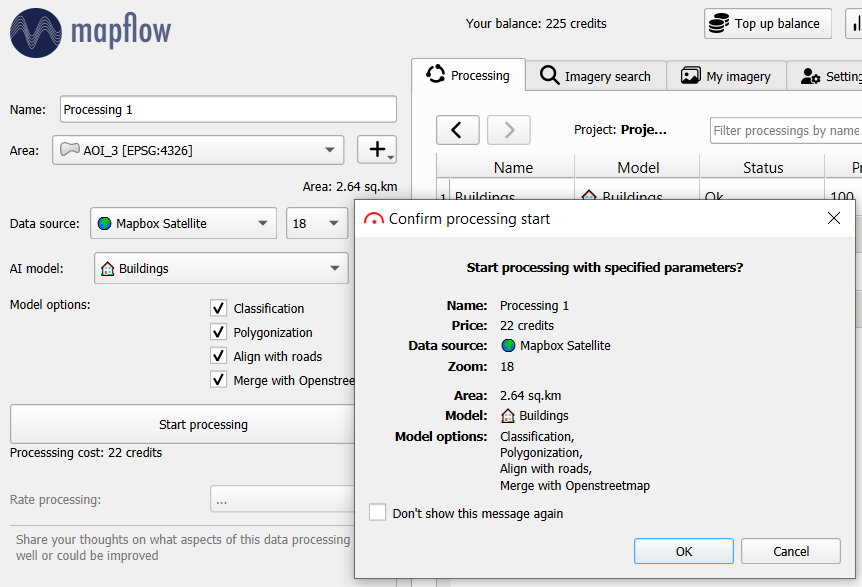
Enable or disable parameter confirmation before starting processing.
After clicking “Start processing”, a confirmation of the parameters will appear
Hint
This tab also contains Output directory button.
Output directory - set up where the processing results will be loaded on your local disk If the savelocalgpkgfiletoviewresult option is selected.
How to search for specific images in the 🌏 Global mosaic
Mapflow Imagery Search enables searching metadata for mosaic providers (e.g., ArcGIS World Imagery, Global mosaic).
Note
🌏 Global mosaic is the annually updated satellite imagery composite covering most of the World. The mosaic is composed of “Jilin” Chinese satellites imagery (RGB, 0.75–0.5 m/px). The preview is limited to zoom 14.
🌏 ArcGIS World Imagery is a provider of the global coverage composed of high and medium resolution satellite imagery and aerial imagery, hosted by ESRI. The frequency of updating images is 1-5 years depending on the territory.
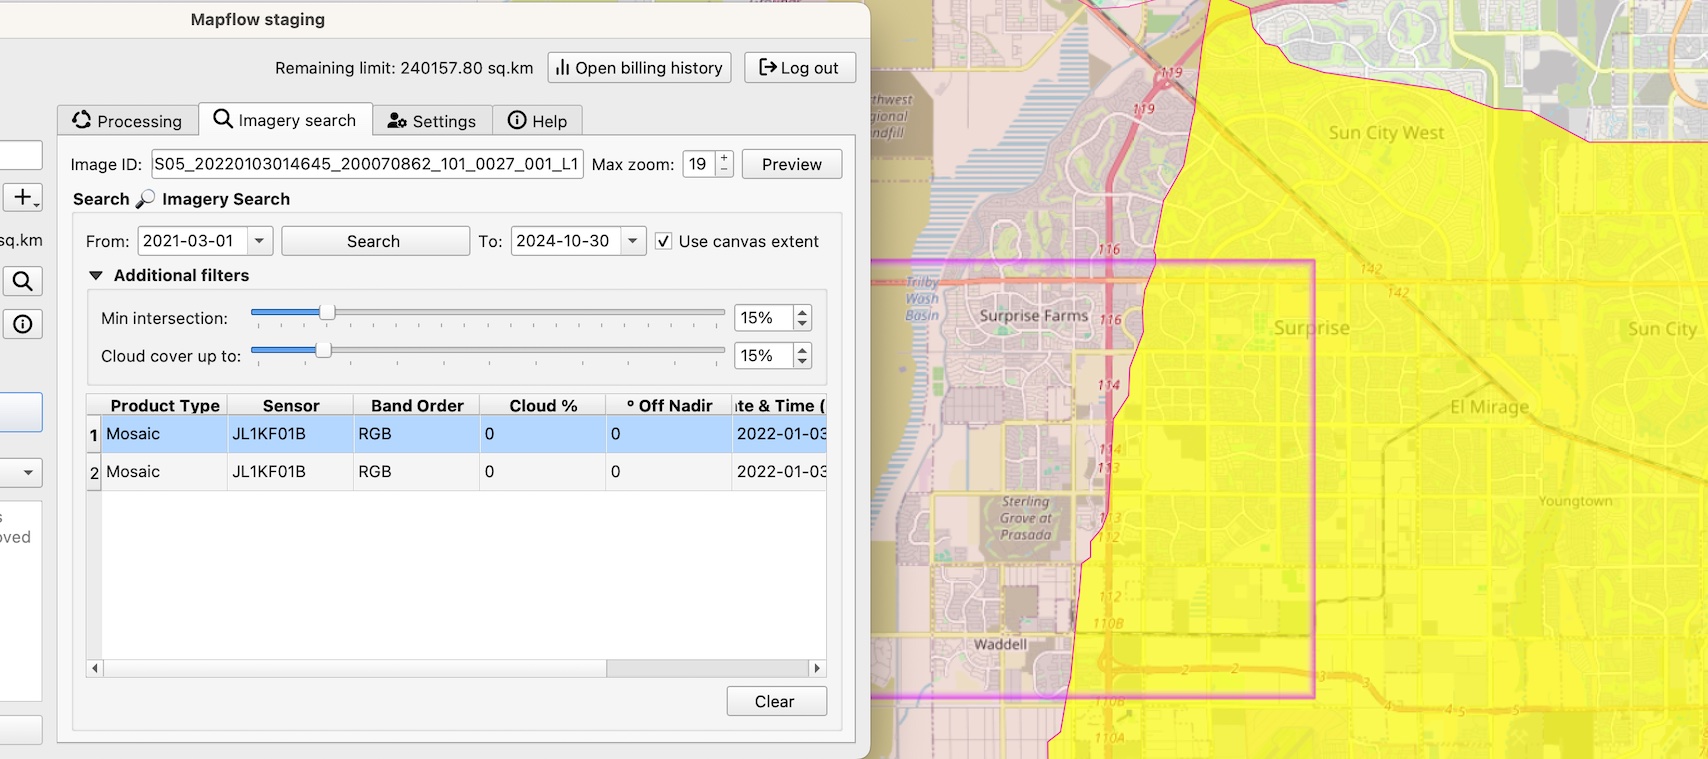
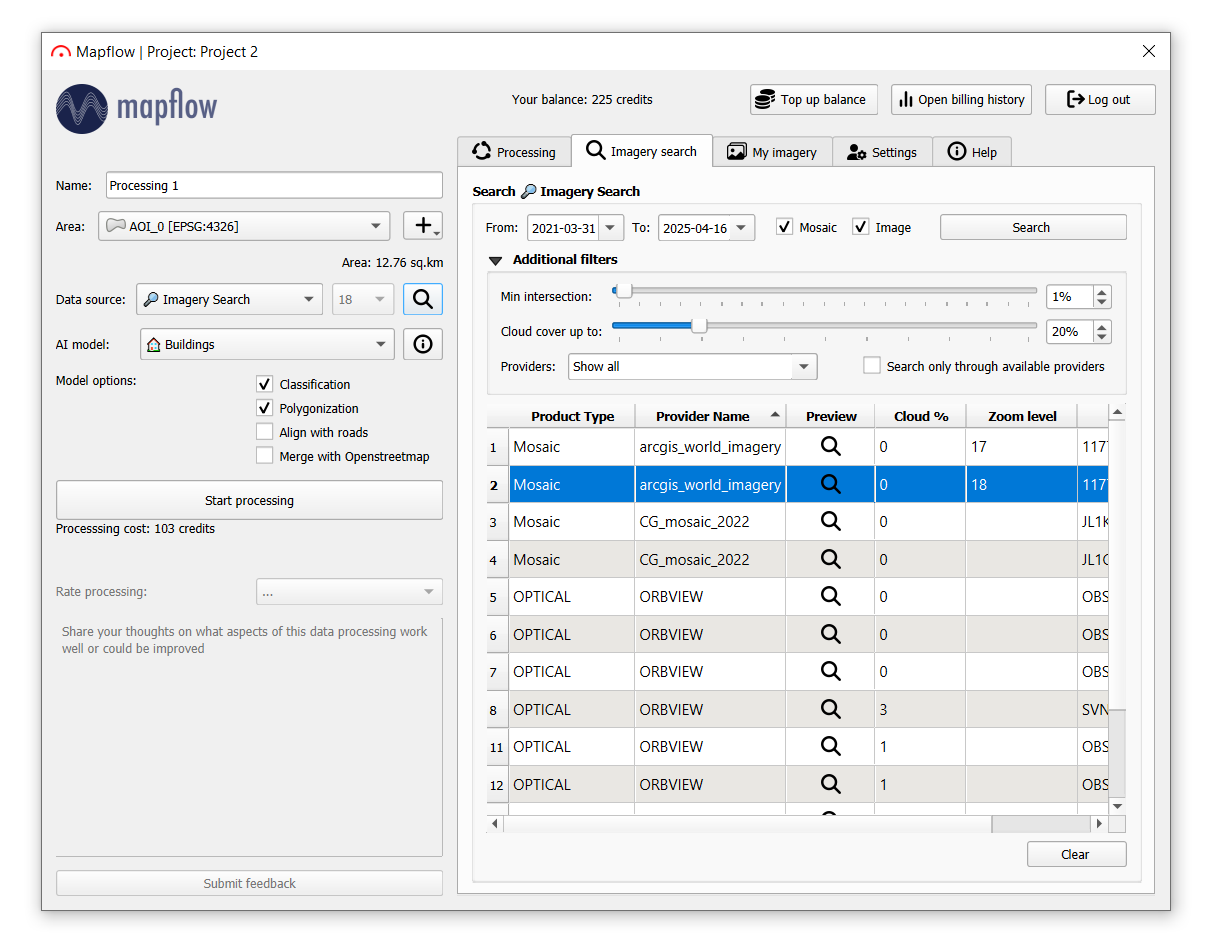
How to use Mapflow – QGIS to search for mosaic’s metadata and run the analysis:
Switch to the Tab “Imagery Search”
Set search filter parameters including the area (it can be your area of analysis or a map canvas), period of time, cloud %, and the % of the intersection with AOI.
Select the “Product type = Mosaic” in the Search results. You will see the mosaic image “cutline” indicating the specific image that is used in the mosaic.
Note
There are two types of products in the Imagery Search API available:
* The Scene product is available for ordering by request. Now you need to contact us to order the specific image.
* The Mosaic product is available for instant analysis if the corresponding data provider is linked to your Mapflow account.
Run the processing. The resulting area of analysis will be clipped by the intersection with the area of analysis.
To run the processing over the whole area of analysis – just clear the selection and use the Data Source: 🌏 Global mosaic 2022 or the Data Source: 🌏 ArcGIS World Imagery.
SecureWatch (new name - ) is a service that provides global access to high-resolution satellite images and imagery basemaps from the world leader in remote sensing, MAXAR, through the subscription model. The spatial resolution of images varies in the range from 30 cm to 1 m. All images are accompanied by metadata, including information about the acquisition date and time, cloud cover etc. In our application we implemented the special interface to connect to this service and use imagery via Mapflow’s processings pipelines.
Use of embedded Maxar SecureWatch for image processing by Mapflow
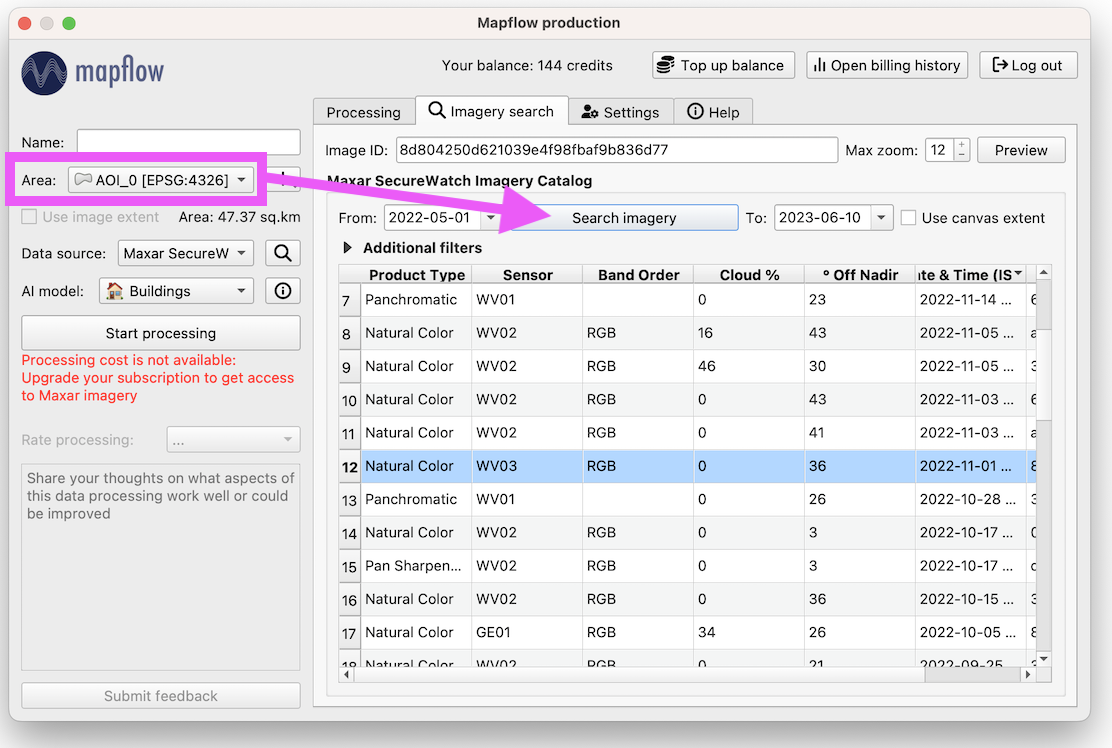
In the Settings – Add or edit imagery providers select the type Maxar WTS, switch to the Imagery search tab.
Maxar preview
Select your AOI in the Area drop-down list and click on the Search imagery.
Double click on the selected image in the search results (or click Preview button) to add it on the map.
Important
In the free tariff plan the Max zoom is limited up to 12 and the processing cannot be started using SecureWatch. If you want to use this data provider - you have to switch to the Premium tariff plan or write to us to get a quote.
Using your SecureWatch account for image processing by the Mapflow
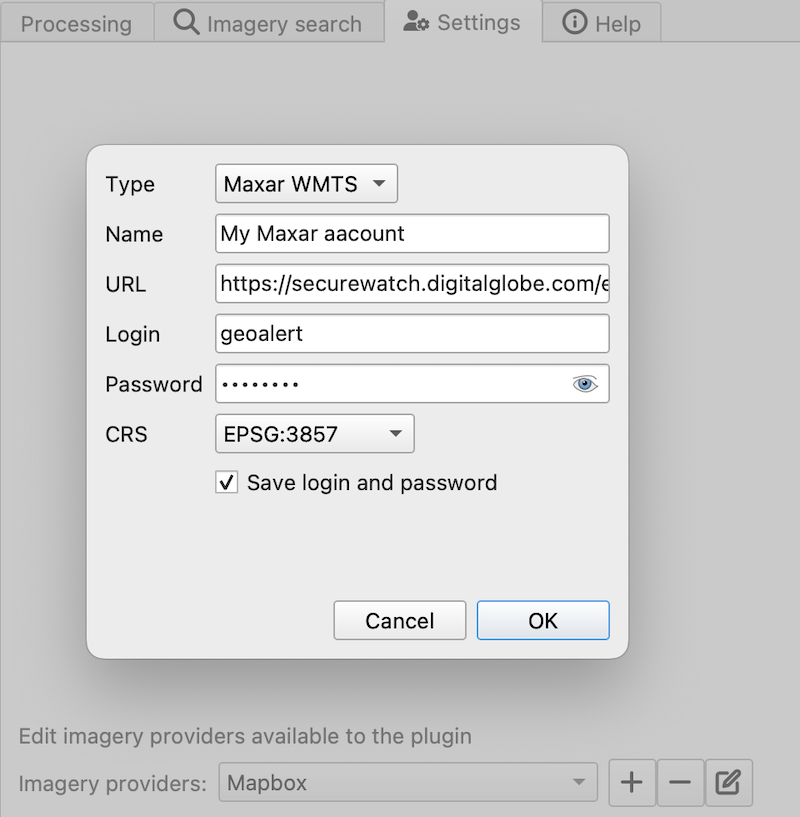
Click + button and choose Maxar WMTS option in the dropdown list;
Enter Login / Password from your Maxar SecureWatch account;
Enter WMTS URL link for Maxar Secure Watch (SecureWatch - Login - Securewatch - Use with - Web Services - WMTS)
Optional: specify the coordinate system (default epsg:3857);
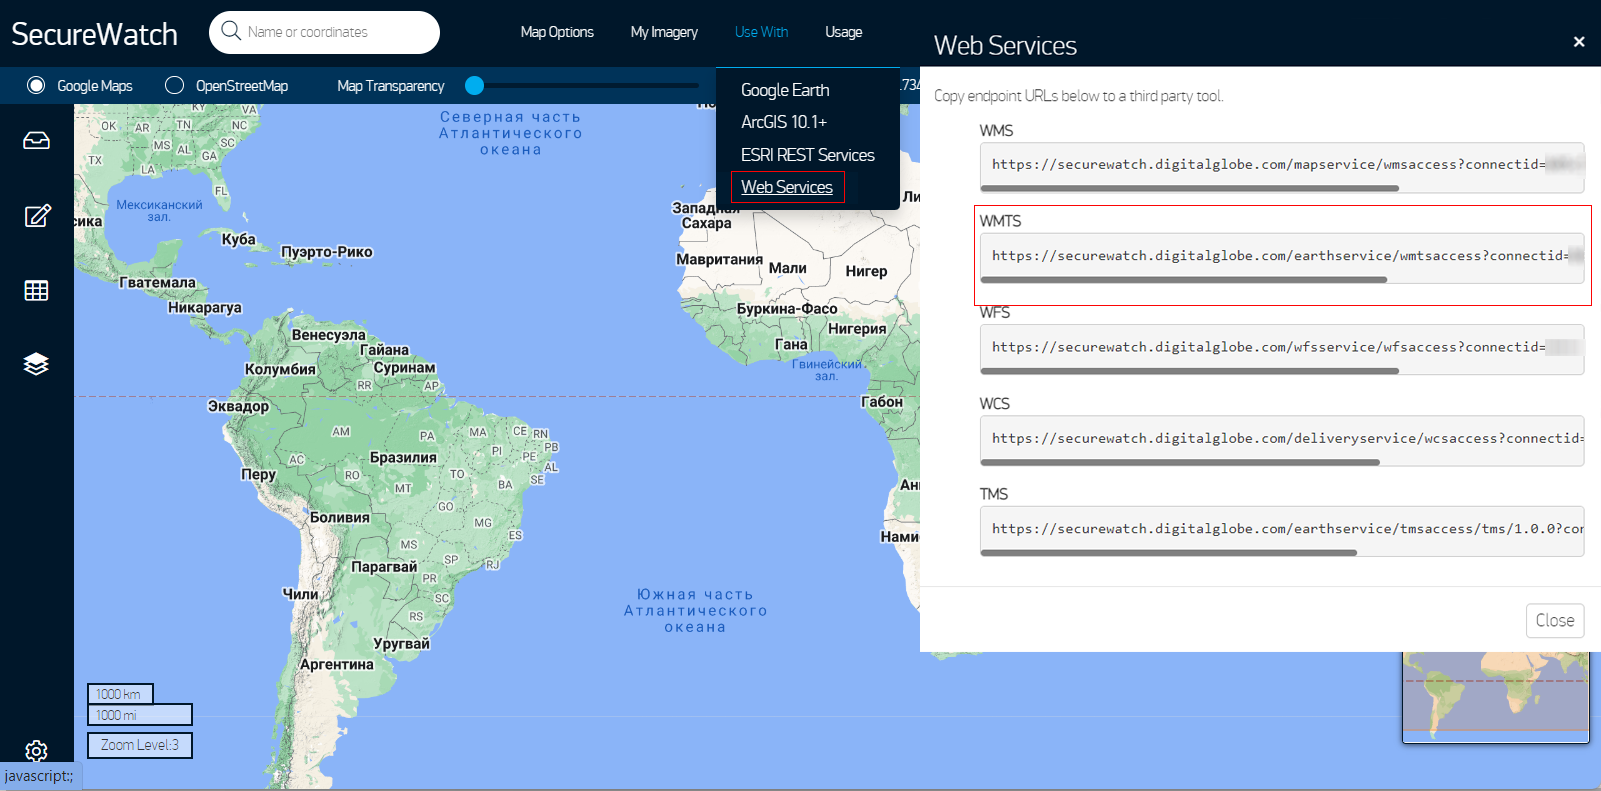
In the upper menu select Use With >> Web Services >> WMTS
Copy the WMTS (or TMS) url.
The Connect ID is different for each product you have in your SecureWatch subscription. Therefore, initially choose the one you want. To do this, open the User Profile menu and in the title bar select the required of the two suggested mosaics (Vivid and SecureWatch).
Click Preview.
Now the Maxar layer is available for preview in your raster layers list and for the AI-mapping processing using Mapflow.
How to find and process the image by Feature ID using Maxar SecureWatch
You can use SW to discover available images for you area of interest.
Go to the Providers tab.
Select Maxar SecureWatch from the dropdown list.
In the Maxar SecureWatch imagery Catalog select the vector layer containing the boundary of your area of interest.
Note
To define the imagery search area you can create the new polygon (Layer -> Create layer -> …, select Polygon as a geometry type, add polygon using the tool Add polygon feature) or upload it from the file with coordinates. If there is more than one polygon in the file, select with the tool Select object(s) the polygon you need. For more information on creating and working with vector layers, see the QGIS User Guide.
Alternatively, you can check the option “use canvas extent”.
Search imagery, to view meta-data of all available images intesecting your AOI. You can apply search filters and specify the period for which you would like to receive images. This will help in forming an imagery catalog with the necessary parameters.
Select the prteferable image from the imagery catalog or use the WFS generated vector layer (Maxar SW metadata) to search through more attributes. If you want to process a specific image in advance, insert your image ID in the field on the top of the plugin, this will make it easier to find the image in the imagery catalog.
Note
Imagery metadata is saved in the form of vector layer. You can interact with its Attribute Table by searching through all attributes.
Click Preview to view the selected image in the form of new raster layer (or double-clicking on the row in the table).
Attention
“max zoom 12” checkbox is active to prevent the paid streaming on the side of Maxar SecureWatch.
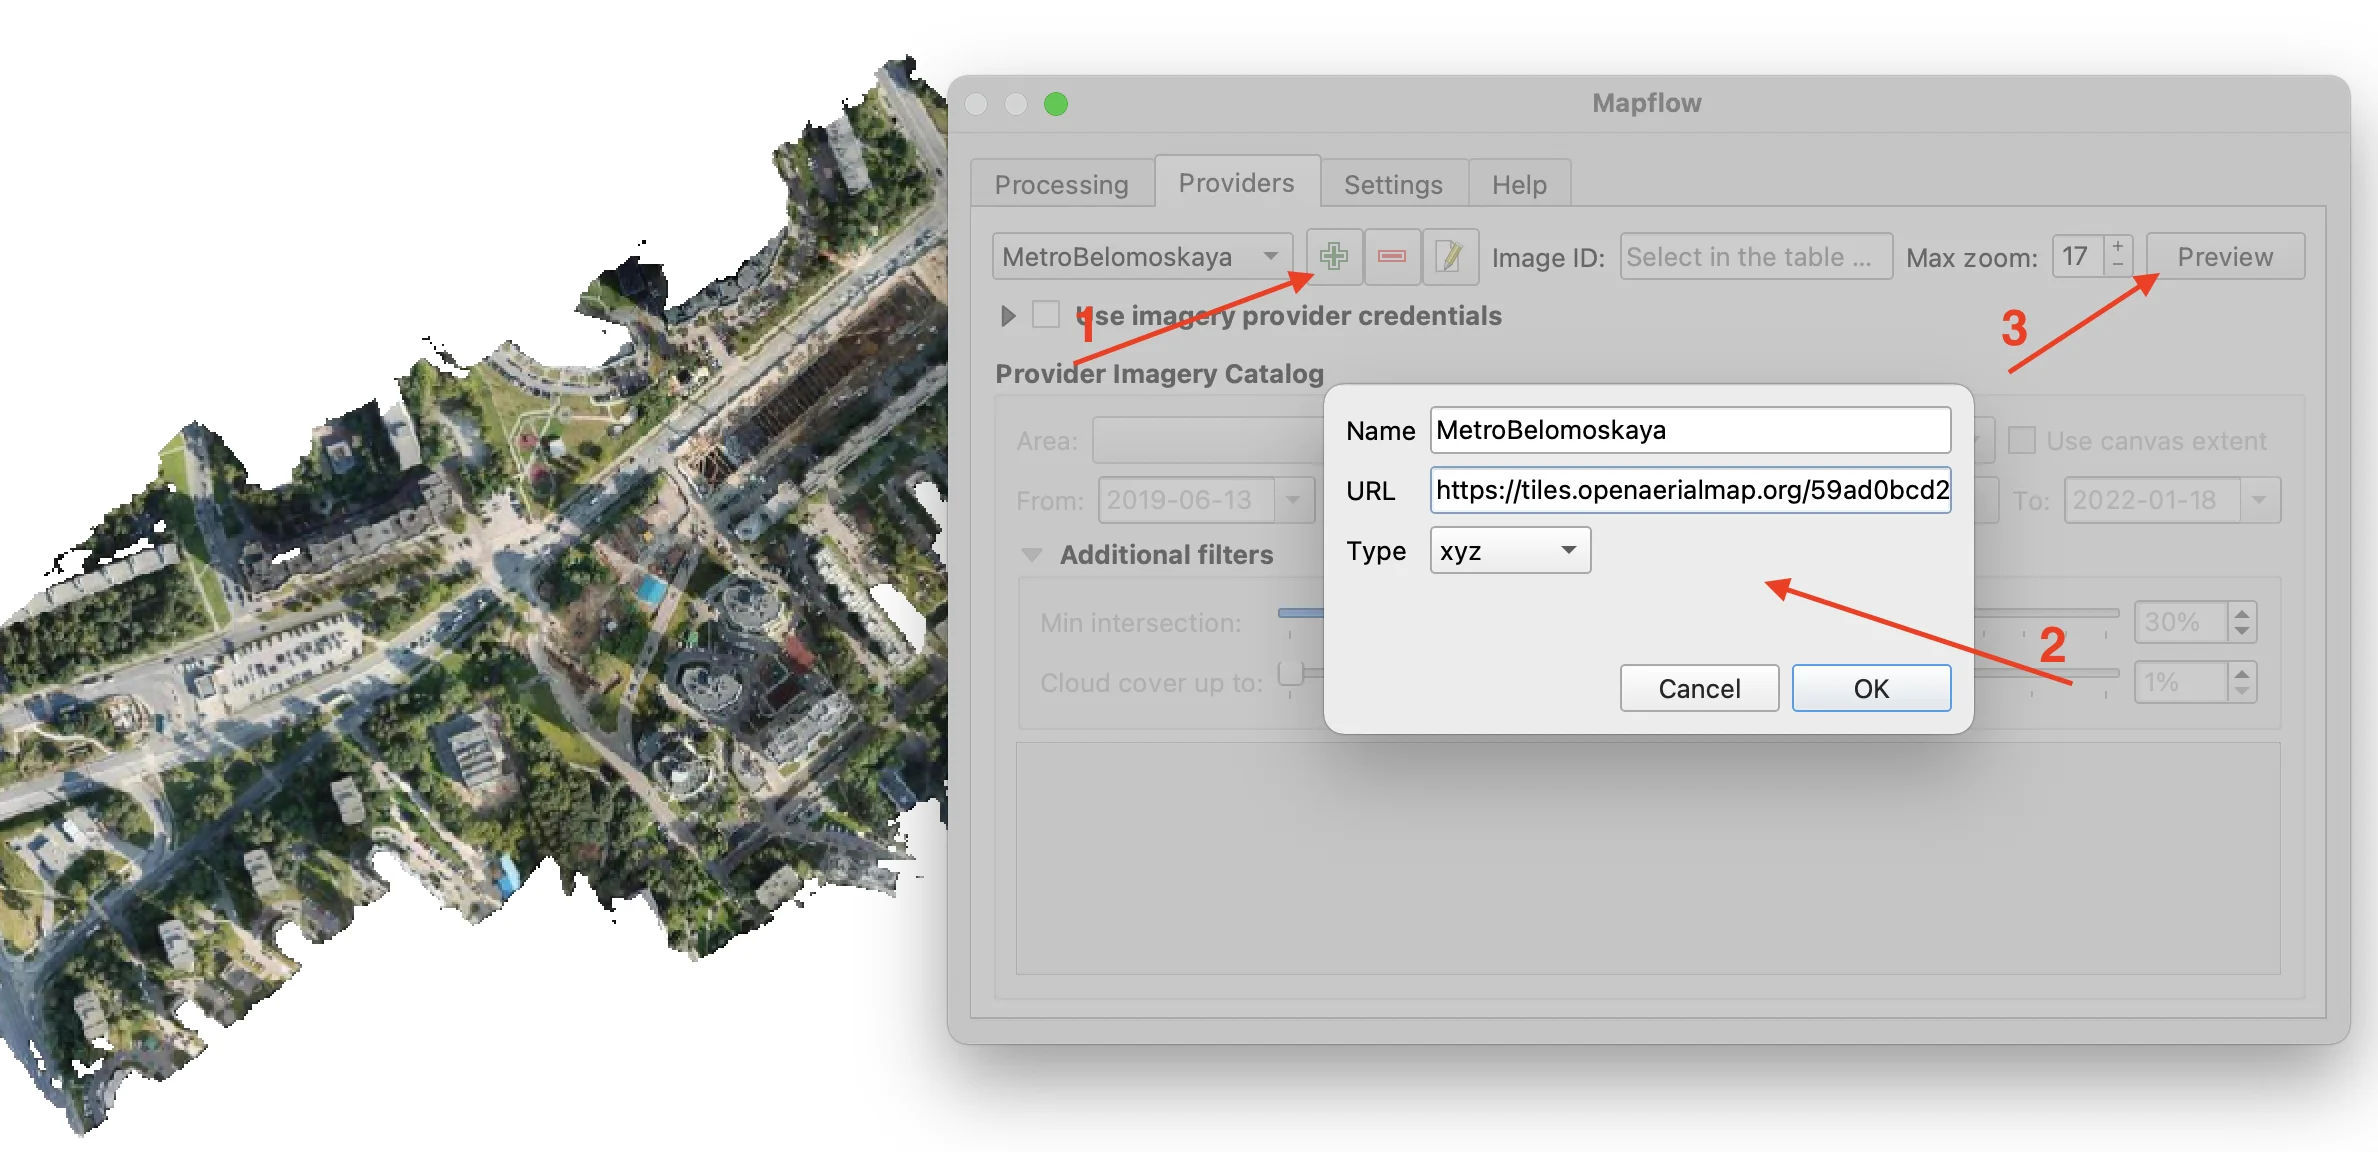
Go to the plugin, on the Providers tab click on the Add (1) and enter the relevant data in the opened window (2). Click the Preview (3) the image, - you must be at the correct zoom and coordinates to see the image.
To start processing using this data source, go to the Processing tab, fill in all fields of processing parameters, click Start processing.
Name of the field / button
Description
Name
Name of other imagery data provider
URL
URL of the imagery data provider
Type
Data source type. You can enter your custom imagery source URL in one of the following formats: XYZ, TMS, WMS, Quadkey. All formats represent the most widely used protocols to fetch georeferenced imagery via HTTP.
Hint
You can define your own source of data in XYZ format. The example: https://your_site.xyz/{z}/{x}/{y}
Hint
Check for more imagery sources connections in the UserGuide How To:
Please, follow the requirements specified on the page with Reference on using the platform when uploading your own images to the Mapflow platform. If you get the error message while uploading your data, please check the instruction Userguides - How To 👨🏻🎓.
Check the data type
Your data is supposed to be automatically converted into RGB, 8bit. To preprocess your data locally before uploading it to Mapflow you can use the preprocessing script
Check the image size
Both sides image dimension must not exceed 65535x65535 pixels. If you have larger images you should either cut them in smaller chunks or switch to the Mapflow Premium.
Check the number of channels
Normally, the Mapflow processes 3-bands RGB rendered images. Mapflow platform can also process single-band (panchromatic) imagery, but the quality of the result may be worse than expected.
Check the projection and georeference
Make sure that your imagery is georeferenced in geographic or projected coordinate system.
Check the resolution
The resolution restrictions vary for different models, see Model requirements
The processing results that are 100% complete can be downloaded as a vector file to your local directory or streaming as a vector tiles and automatically added as layer to QGIS workspace.
Double click on the processing name in the Processing table or select it and push the button “View results”.
The layer will appear in the Layers panel (QGIS –> View –> Panels –> Layers) in the folder “Mapflow”.
You can work with it further as with the usual vector layer in QGIS.
Note
If the default AI model is used, the plugin automatically assigns predefined styles to the vector layer. For all custom models / pipelines the single default style is assigned. You can always change it.
The processing results, which are 100% complete, can be downloaded in GeoJSON format, to do this, click on the Saveresults button, select output directory in the window that appears and name the file to be saved.
To delete the processing - select it in the list, click the button “Delete” and confirm.
Warning
The processing cannot be restored by user. Before the permanent deletion the data backup is temporarily stored on the Mapflow server in case of emergency. So if you deleted your results by mistake and want us to restore the processing – send your request to the support without delay.
❗️ This option is available for the limited number of Mapflow customers who have signed up for the enterprise support
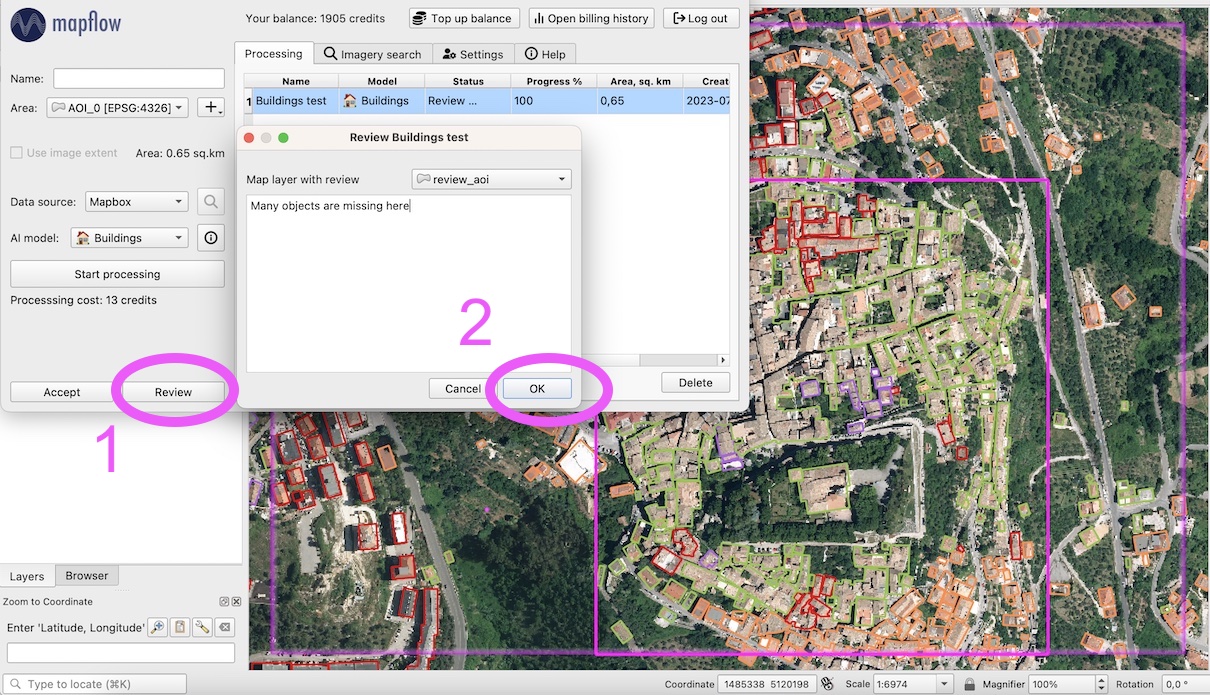
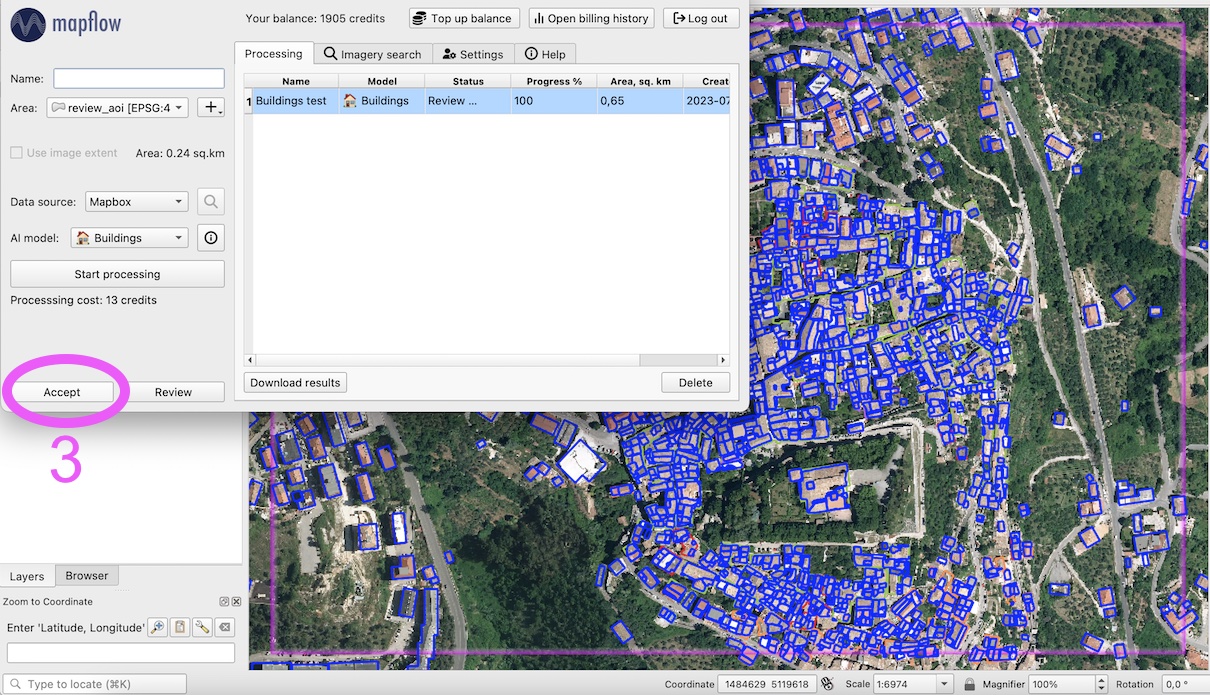
If activated, every completed processing comes with the status “Review required”. The user can either accept the result or request the review, so the support can reprocess it and get better results, until it meets the requirements.
To request the Review of the results:
Select the processing with the Status “Review required” and click the “Review” button
Provide comments in the Review dialogue:
Add your comment on why and what you want us to make a review
Optionally Add the polygon area, highlighting the objects that are not correctly processed, weren’t identified correctly, etc – it will help us to pay attention to the specific issues
 .
.