Reference on using the platform
Note
This document outlines the requirements for using the Mapflow platform, including supported data formats, preprocessing steps, and model-specific guidelines.
Requirements for using the platform
Upload GeoTIFF requirements
Note
Please pay attention to the following:
Images you upload are preprocessed in Uint8 format. If your image is not of this type and you want to preview it manually before uploading to the Mapflow server, please use our image preprocessing script or other tools to translate it to the appropriate format;
Your image must be georeferenced in geographic or projected coordinate system, ellipsoid WGS84, it is recommended to use UTM or Web Mercator;
The default limit for file size is
1 Gbfor free users. If you have a bigger file – reduce its size or consider switching to the paid plan;Your image should be RGB composite, RGBa or Singleband;
Maximum image dimensions:
65535 pxper side;Pixel size must not exceed
20 m/px;Images with a pixel size less than
10 cm/pxwill be resampled to this resolution;All images within a collection must have the same number of bands;
Uploaded image will be reprojected and resampled to match the CRS and GSD (pixel size) of other images in collection;
Each Mapflow model has its recommendations for the spatial resolution of the input data, see Model requirements below.
In case of non-compliance with any requirements, the system reports an error. If you are using Mapflow Web or Mapflow QGIS plugin, the error messages are shown in the user interface. For more details, see errors description.
Model requirements
The table below lists model requirements for spatial resolution of the input imagery.
“Required” means that the imagery with resolution outside of this range will be rejected from processing and the request will fail.
“Recommended” means that the model is fit specifically for this spatial resolution. Any images of higher resolution will be downsampled before processing, so it gives no profit to upload higher resolution. Images of lower resolution (if meeting the “required” section) will be upsampled, but the results will not be so good as for recommended resolution.
GSD is specified in UTM coordinate system, and may not correspond to what you see as “pixel size” if your image’s coordinate system differs.
Learn more about zoom and spatial resolution of imagery basemaps.
Model |
Description |
Recommended zoom |
Recommended GSD m/px |
Required zoom range |
Required GSD range, m/px |
|---|---|---|---|---|---|
Buildings |
Extract roof contours, with optional classification, simplification and height estimation |
18 |
0.5 |
17 – 19 |
1.5 - 0.3 |
Forest |
Extract segmentation masks of forested areas from high-resolution RGB images |
18 |
0.5 |
18 - 20 |
0.75 - 0.15 |
Forest Heights |
Classiy masks of forested areas by height classes based on predefined thresholds |
18 |
0.5 |
18 - 20 |
0.75 - 0.15 |
Tree crowns |
Extract segmentation masks of tree crowns. Optionally converts to points or polygons. |
19 |
0.3 |
19 - 20 |
0.3 - 0.15 |
Roads |
Extract road mask from high-resolution satellite imagery |
18 |
0.5 |
17 – 18 |
1.2 - 0.1 |
Constructions |
The model highlights areas in the satellite image that contain construction sites and buildings under construction |
18 |
0.5 |
17 – 18 |
2.0 - 0.5 |
* Mapflow.ai can also process single-band (panchromatic) imagery, but the NN models are not tuned for such kind of data, so the quality of the result may be worse than expected.
Forest mapping classes
Here is presented a list of classes for the Forest vegetation Mapping Model. There are two options for forest semantic classification:
Classification by heights – classification of the areas of vegetation and shrub vegetation by height classes according to the specified thresholds: 0-4 m, 4-10 m, 10+ m. Forest areas of each height class are polygonized in separate features, the height class is indicated in its properties. Heights thresholds are customizable values in the processing pipeline.
Classification by overgrowth density – classification of the area of vegetation and shrub vegetation into classes according to the density and height: high forest, low (growing) forest, open woodland, and shrub.
CLASS_ID
DENSITY
Description
00m-04m
low vegetation
04m-10m
dense/sparse
medium forest
10m-99m
dense/sparse
high forest
Buildings mapping classes
CLASS_ID
CLASS NAME
DESCRIPTION
OSM refereral tag
101
Apartment building
Roof footprints of the multistorey apartment buildings
building=yes building=residential building=appartments
102
House
Mostly private houses (usually represents a single household)
building=house building=residential
103
Industrial building
Mostly industrial (Plants, large hangars, warehouses, etc.)
building=industrial
104
Commercial building
Offices, retail, etc.
building=commercial
105
Other non-residential buildings
Garages, transformer boxes, small hangars, etc.
Buildings Mapping visualization with ArcGIS Online, Carto, etc
Mapflow Web easily processes imagery and extracts vector objects that can be downloaded in GeoJSON format. We recommend using GeoJSON since it is a de-facto standard in web mapping. It is natively supported by web mapping frameworks (e.g. Leaflet or Mapbox) and GIS software like QGIS or the ArcGIS Suite.
Note
GeoJSON is an open standard format designed for representing simple geographical features, along with their non-spatial attributes. It is based on the JSON format. The features include points, linestrings (Mapflow roads), polygons (Mapflow buildings footprints, forest and field masks), or multi-part collections of these types. Mapflow allows different options for actions with processing results stored in GeoJSON. You are able to download or “Open with geojson.io”.
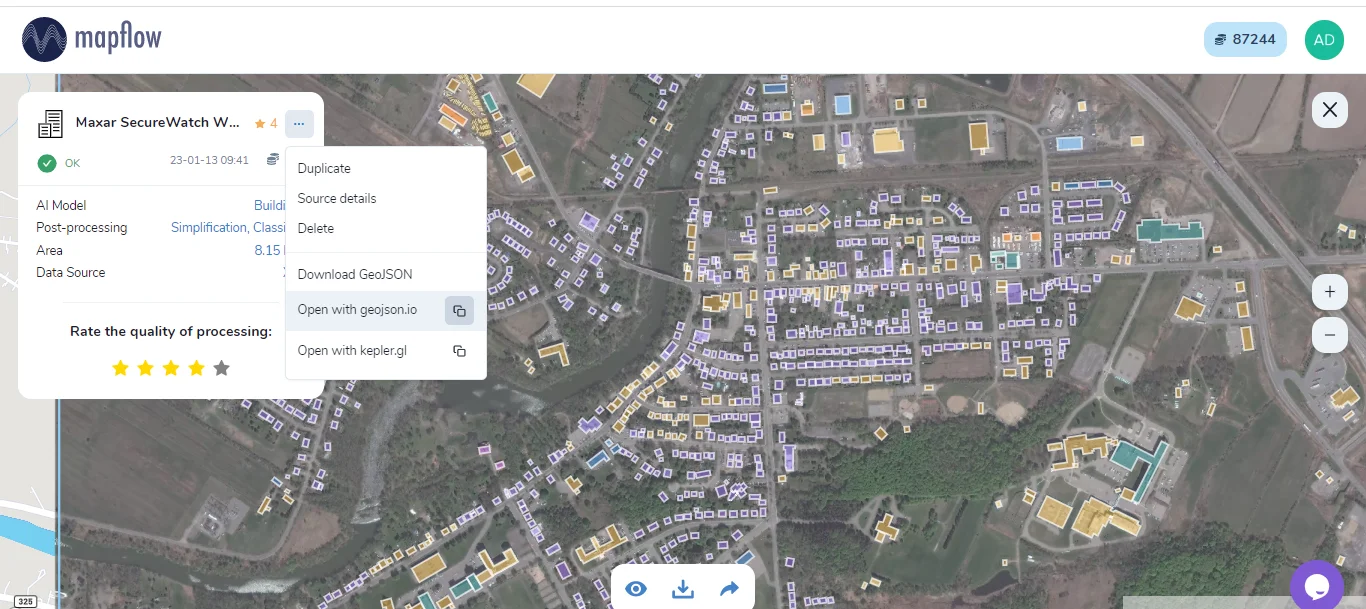
Open with geojson.io
Note
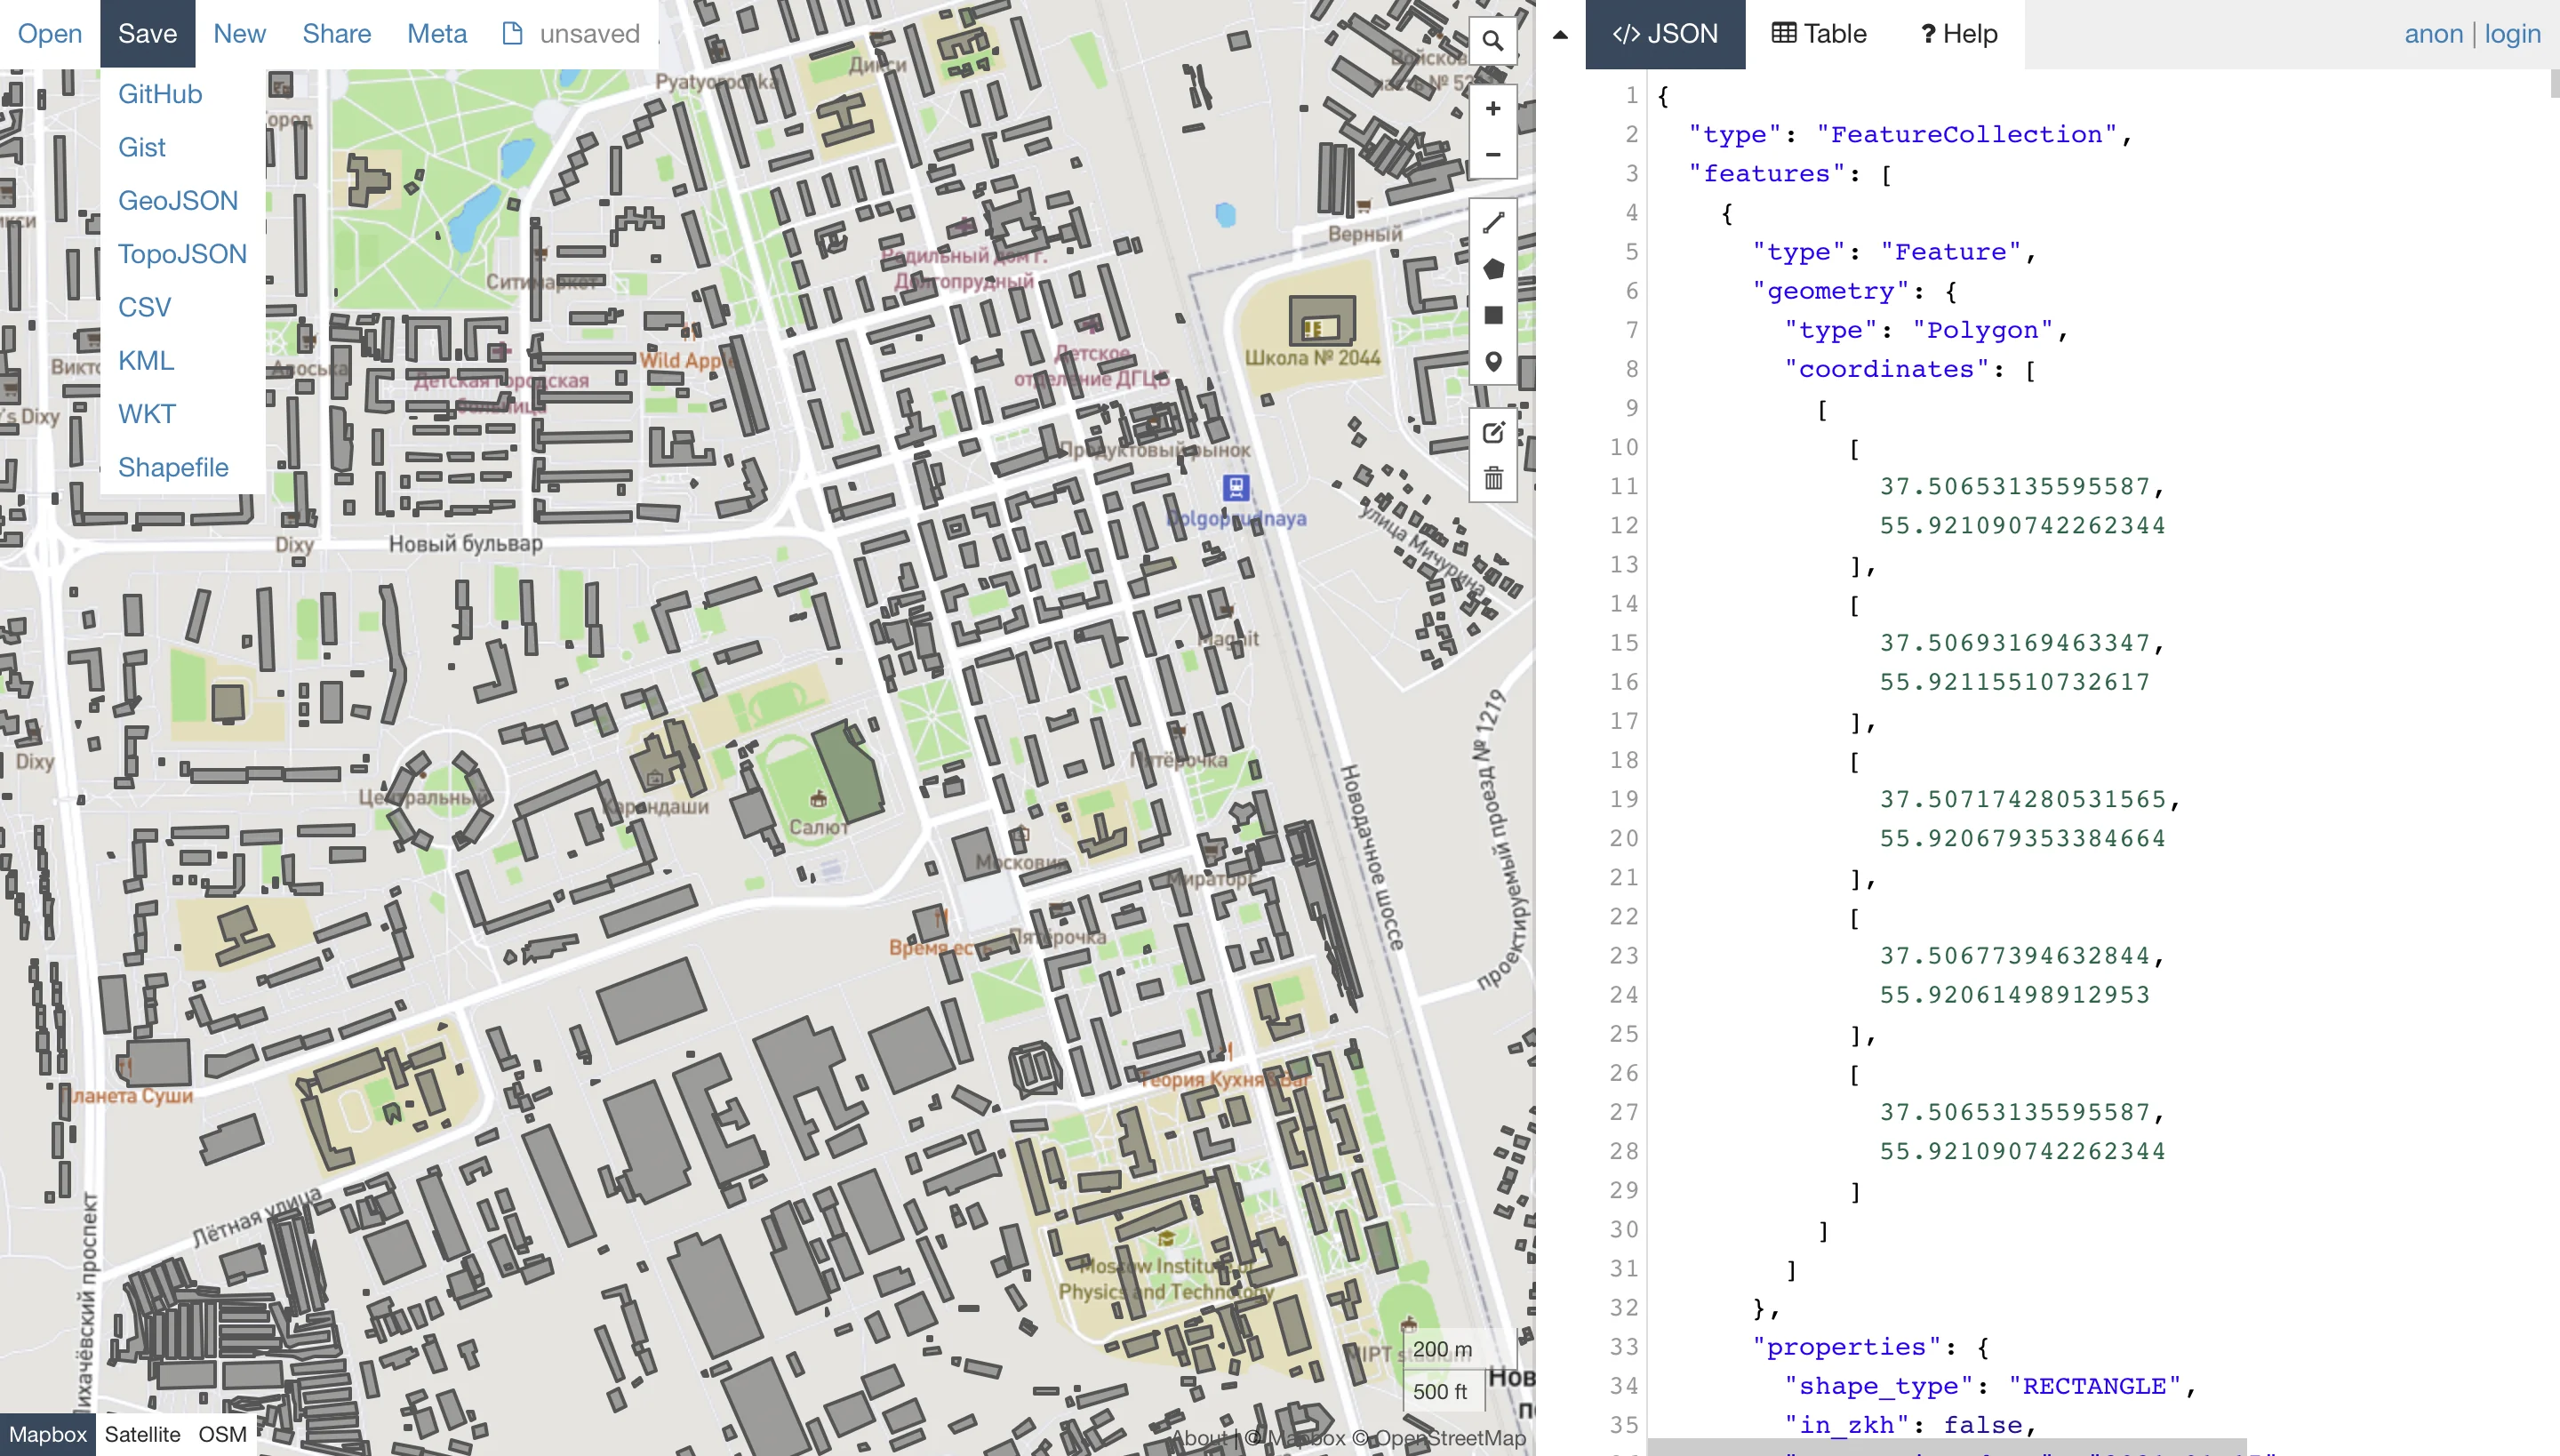
Geojson.io allows you to view and save the results in a different format (CSV, KML, TopoJSON, WKT, Shapefile). Click “Save” and select the format in the menu bar.
Using GeoJSON allows you to use only drag&drop to visualize Mapflow output results in numerous Web-GIS without converting data formats. See this video about how to upload and style a building classification results with ArcGIS online, Carto, and Evergis online.
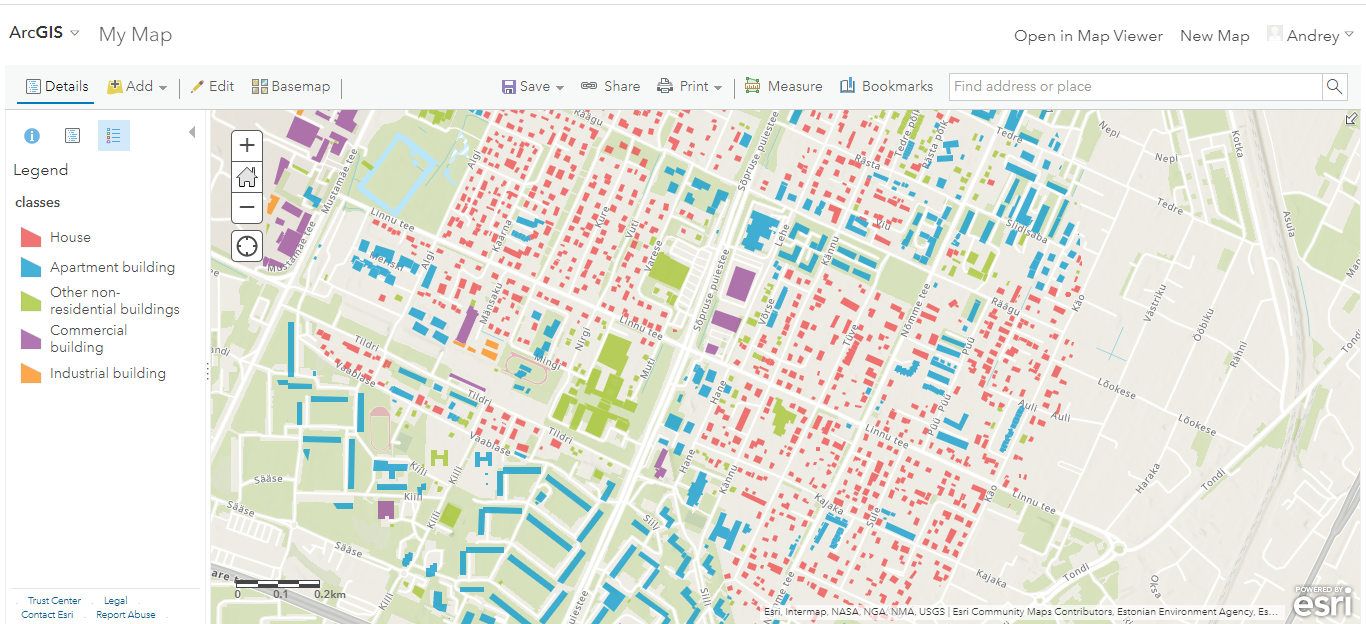
Building footprints in ArcGIS online
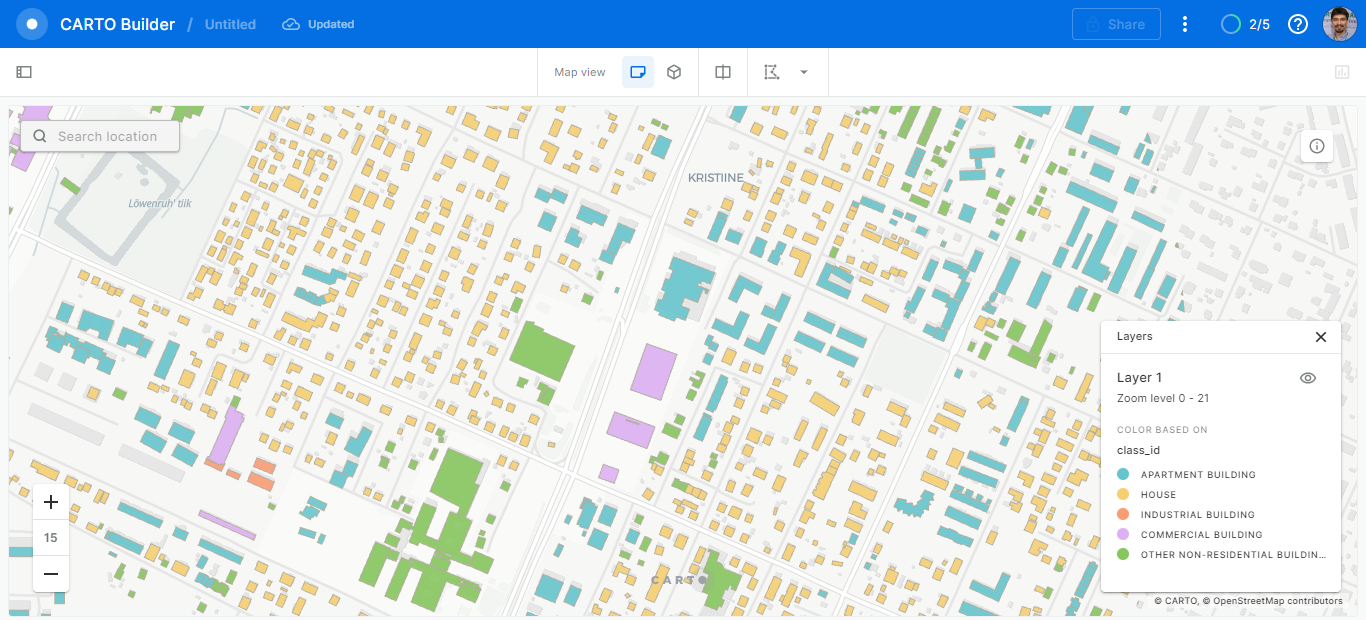
Building footprints in Carto