🏠 Buildings v.2026-07-06 — per-location benchmark
This page details the validation of the 🏠 Buildings v.2026-07-06 segmentation model (Global domain, 0.3 m / z19) on 14 areas of interest (AOI), compared against the previous version v.2025-12-10 (the current production 🏠 Buildings model). For each AOI the two prediction masks are shown side by side; click any image to open it full size, and use the ← / → arrow keys to browse between them.
All metrics are area-based: IoU is the intersection-over-union of the predicted and ground-truth building masks, and F1 / Precision / Recall are computed on the overlapping mask area. Evaluation runs: 2026-06-13 (global set) and 2026-06-16 (satellite set).
Mask colour legend: v.2026-07-06 · v.2025-12-10
Aerial imagery validation set
Validation on the global set of 9 areas of interest (mixed urban / suburban / rural).
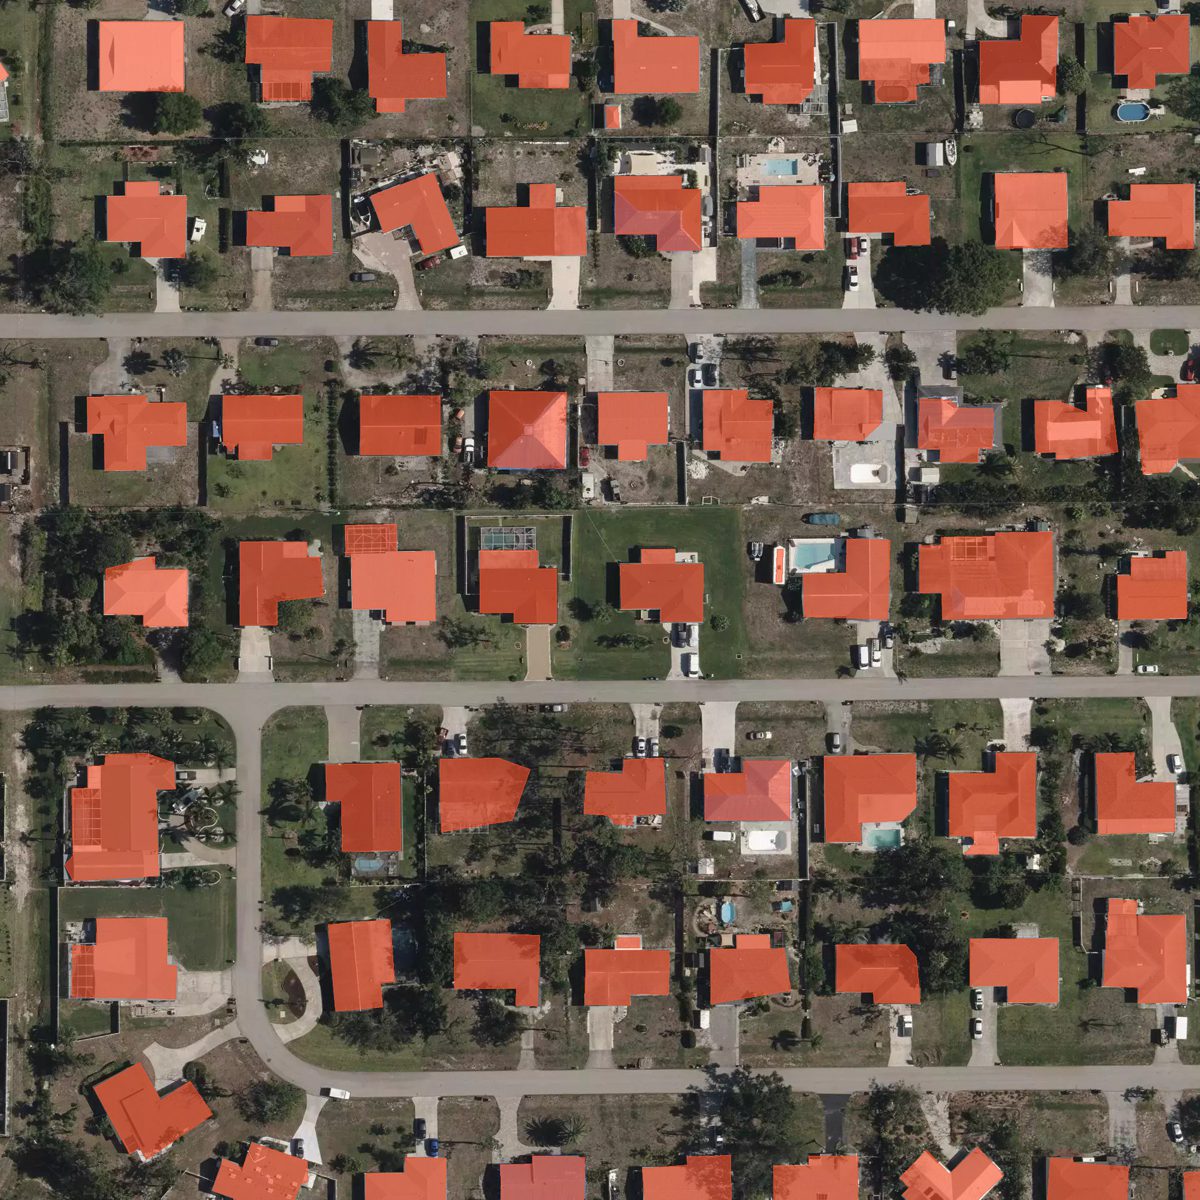
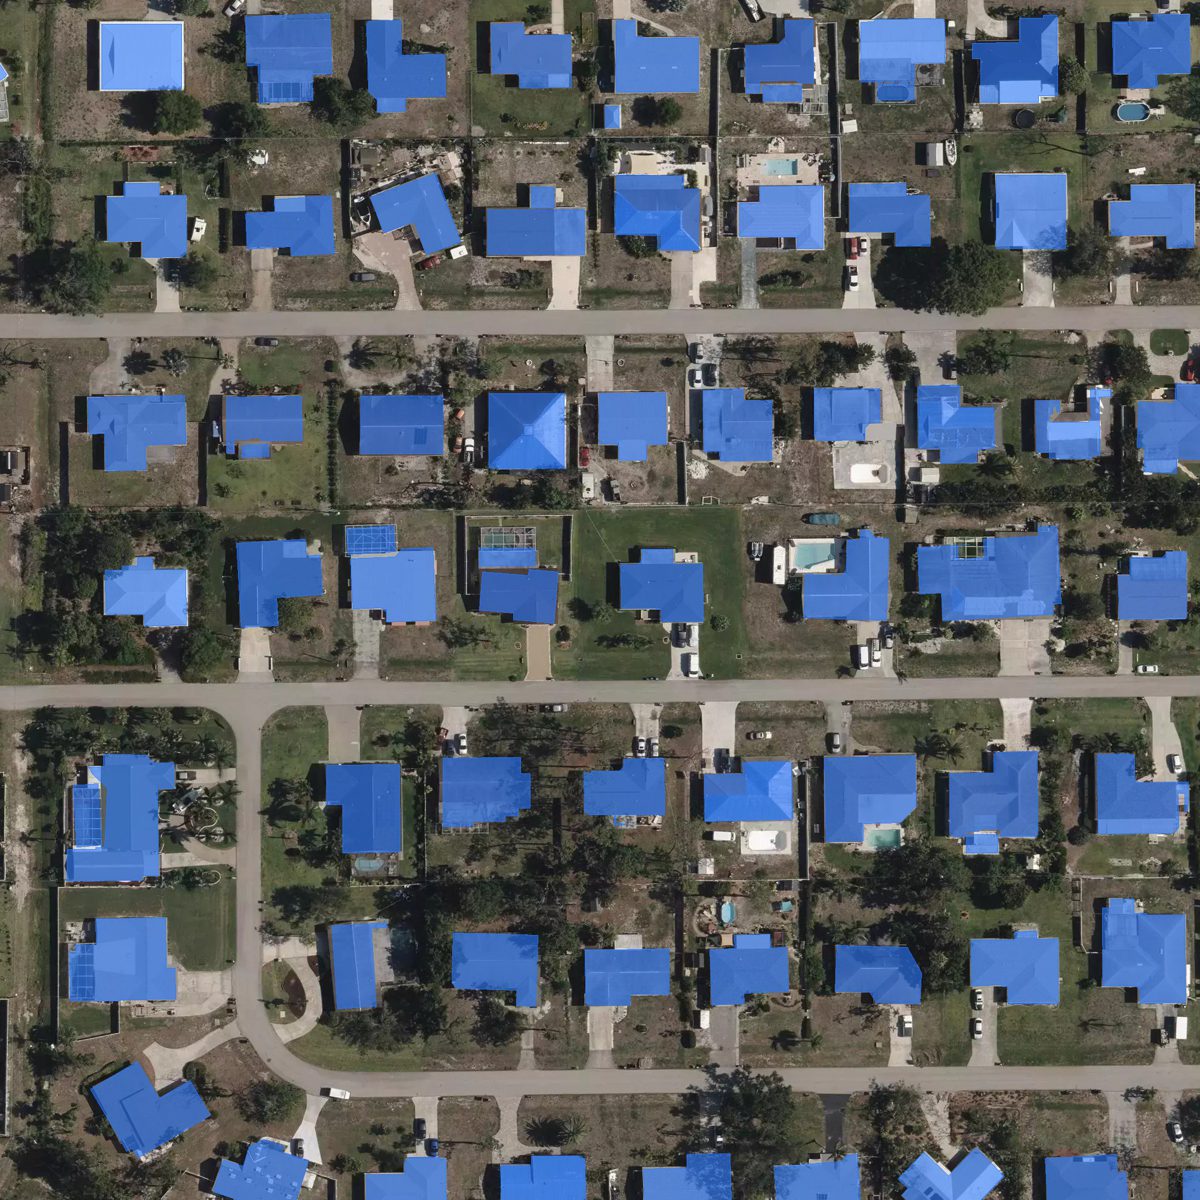
United States — Fort Myers
Model |
IoU |
F1 |
Precision |
Recall |
|---|---|---|---|---|
v.2026-07-06 |
0.907 |
0.951 |
0.983 |
0.921 |
v.2025-12-10 |
0.880 |
0.936 |
0.974 |
0.901 |
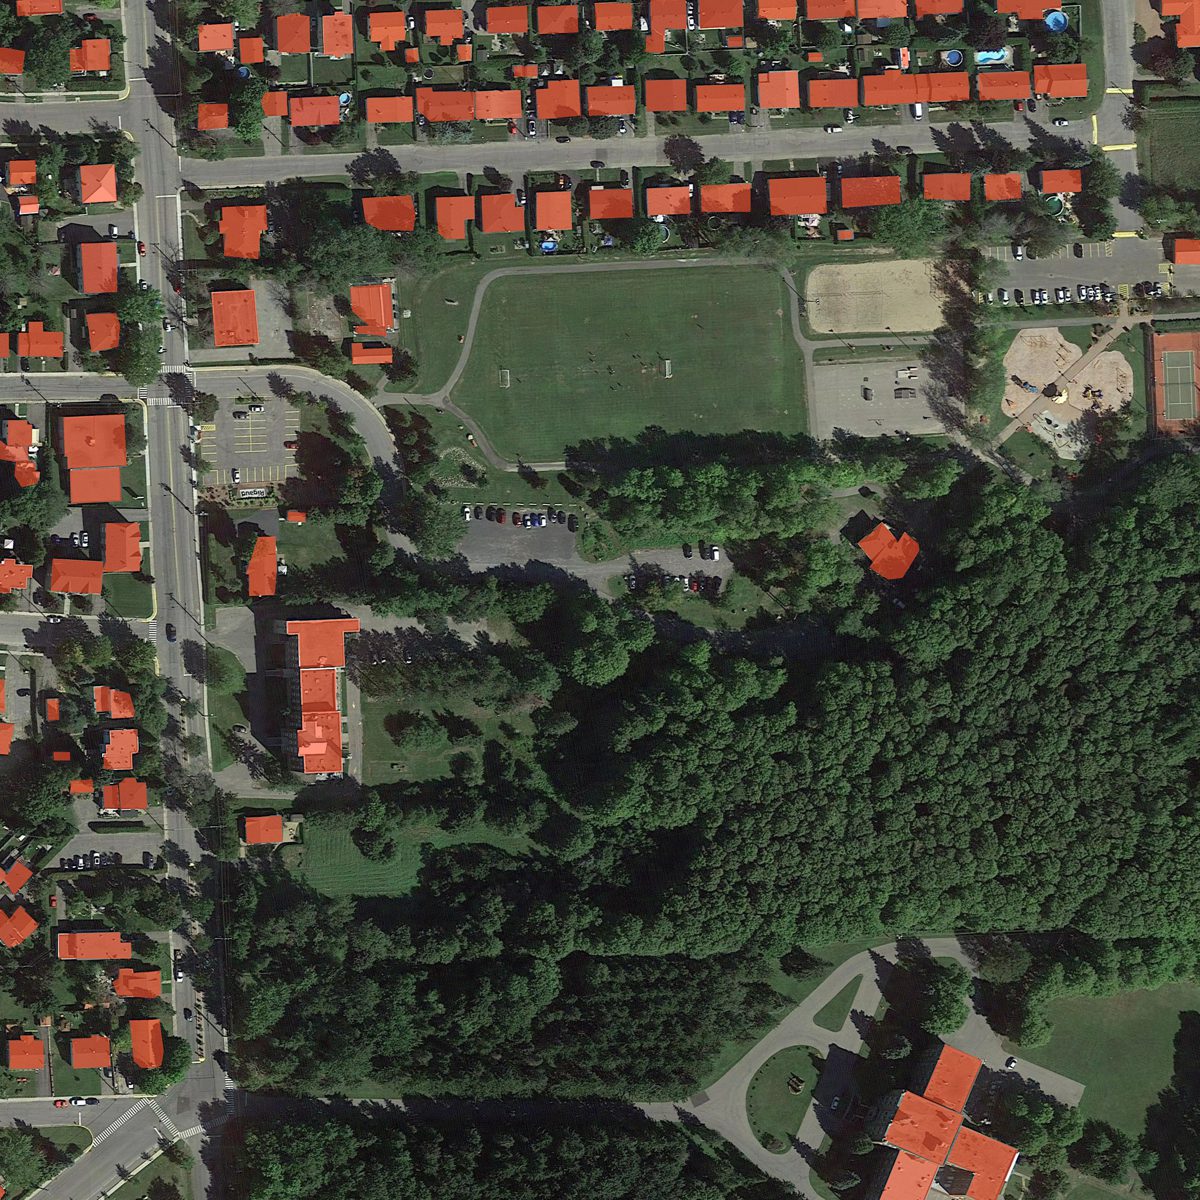
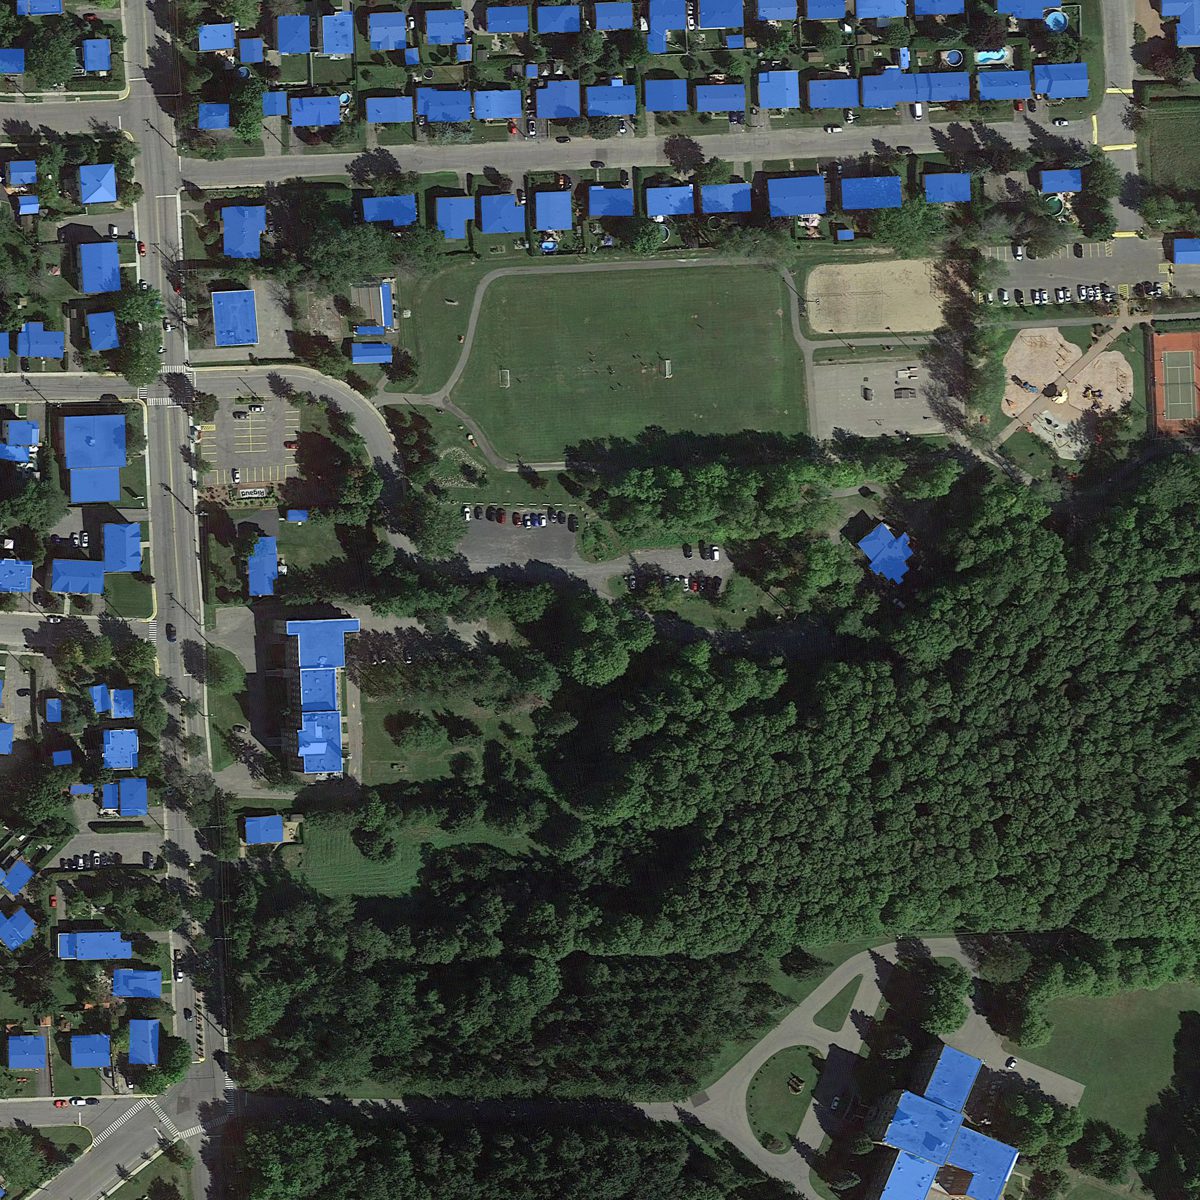
Canada — Rigaud
Model |
IoU |
F1 |
Precision |
Recall |
|---|---|---|---|---|
v.2026-07-06 |
0.870 |
0.930 |
0.934 |
0.927 |
v.2025-12-10 |
0.842 |
0.914 |
0.923 |
0.907 |
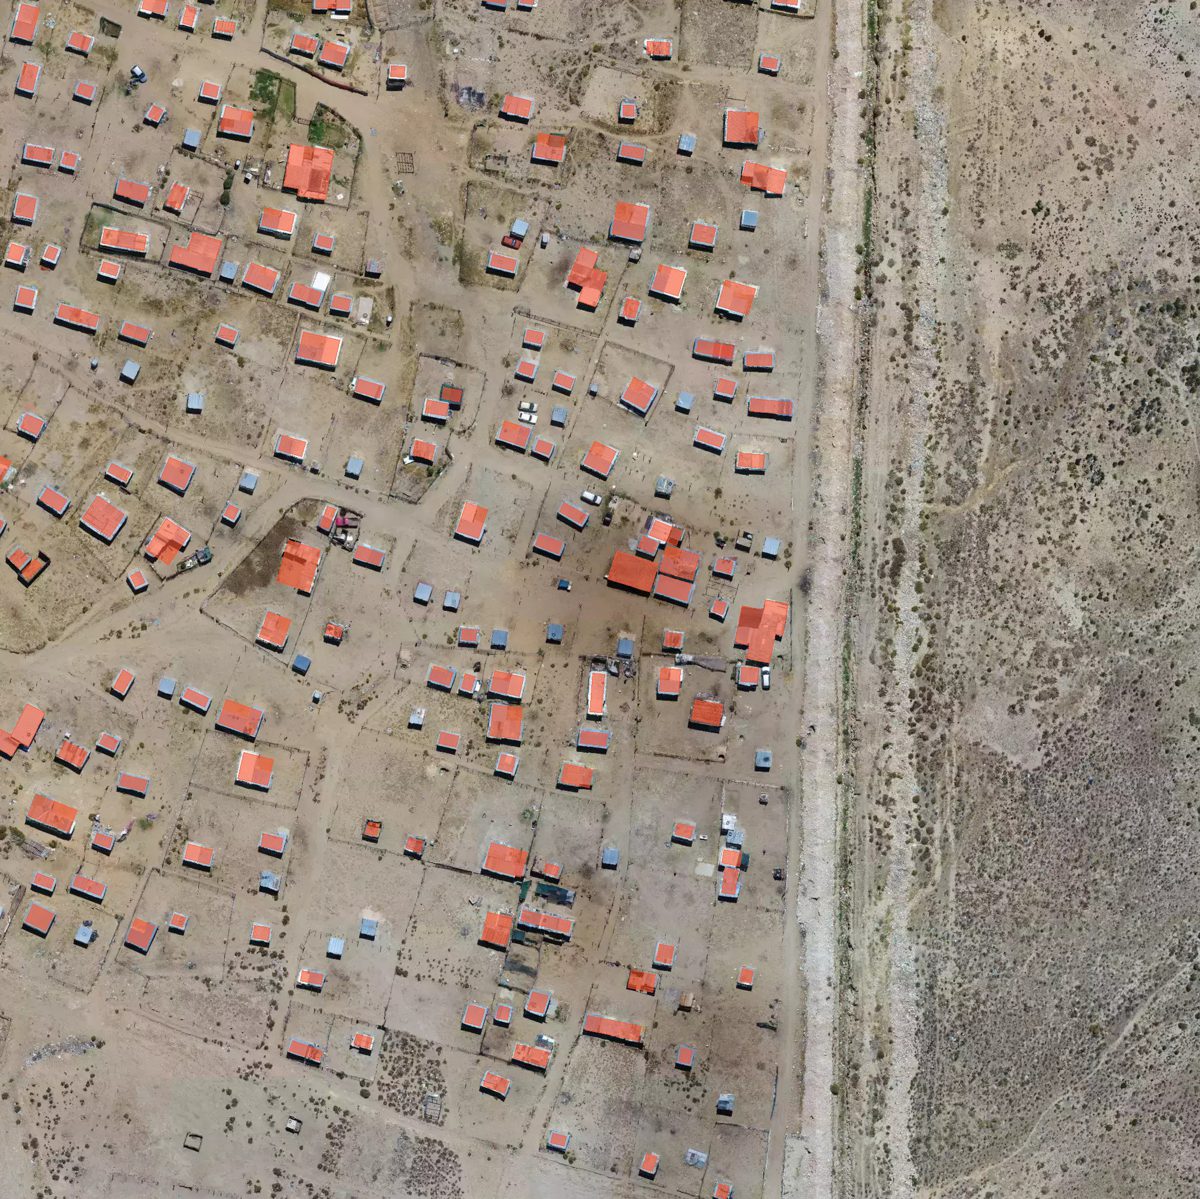
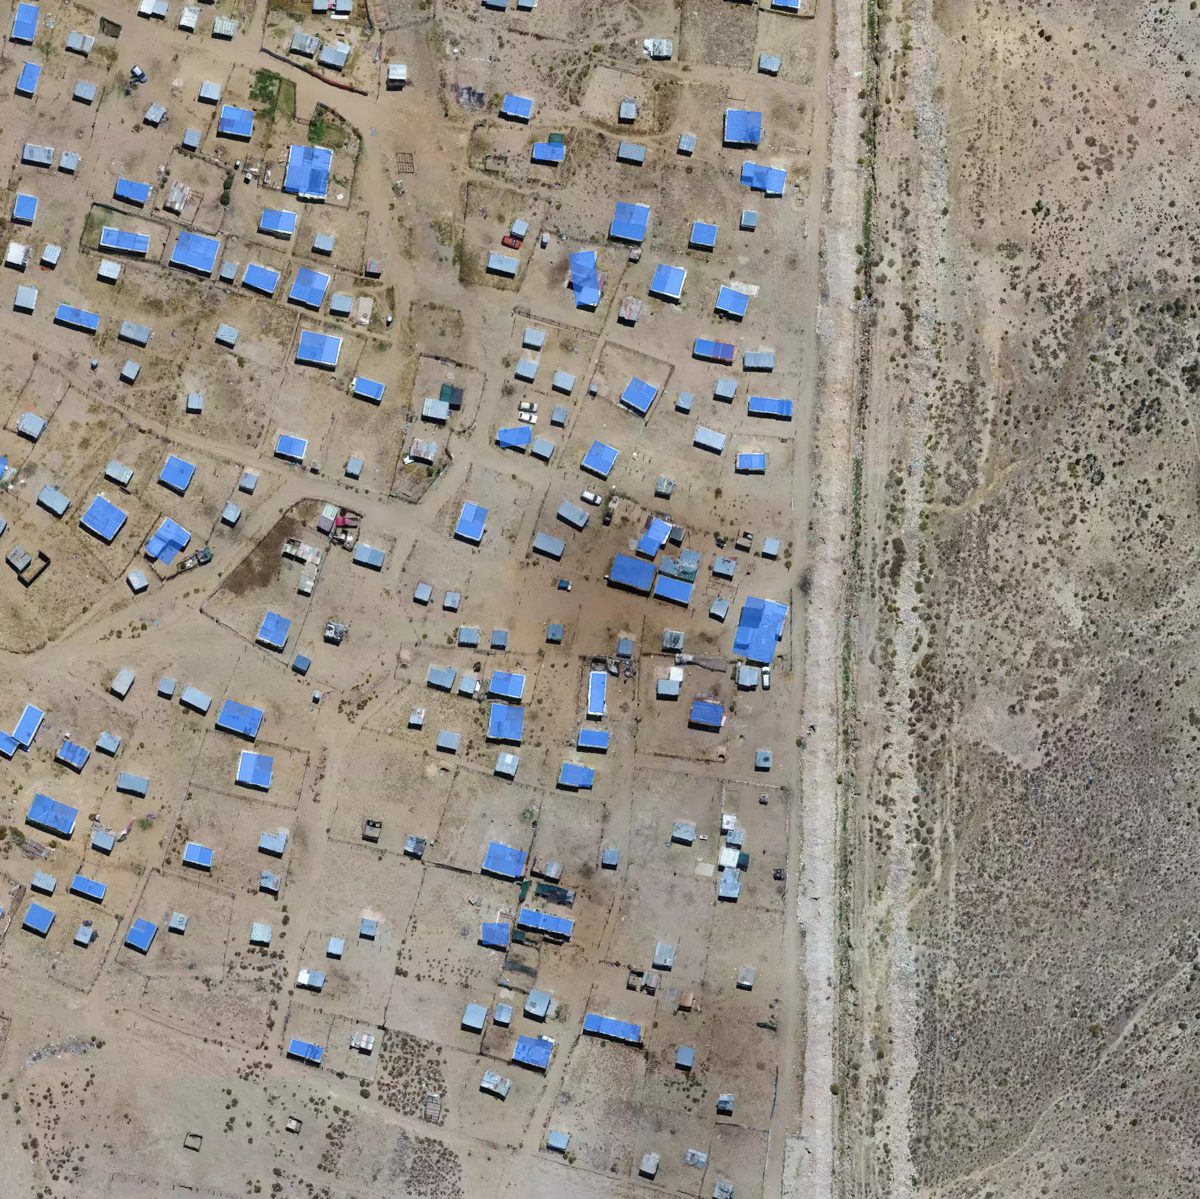
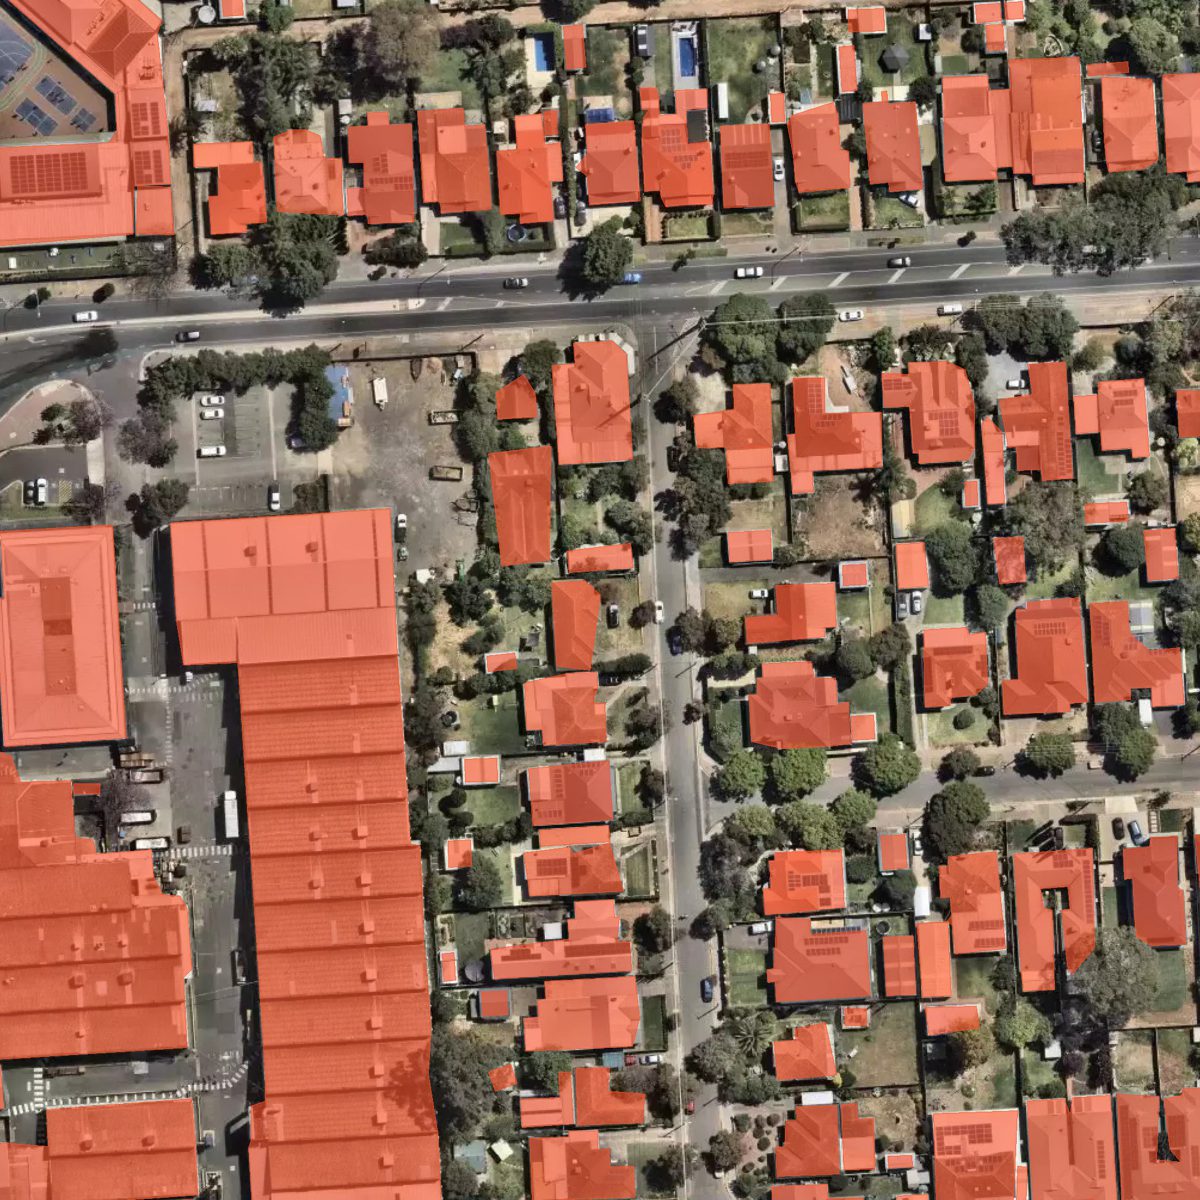
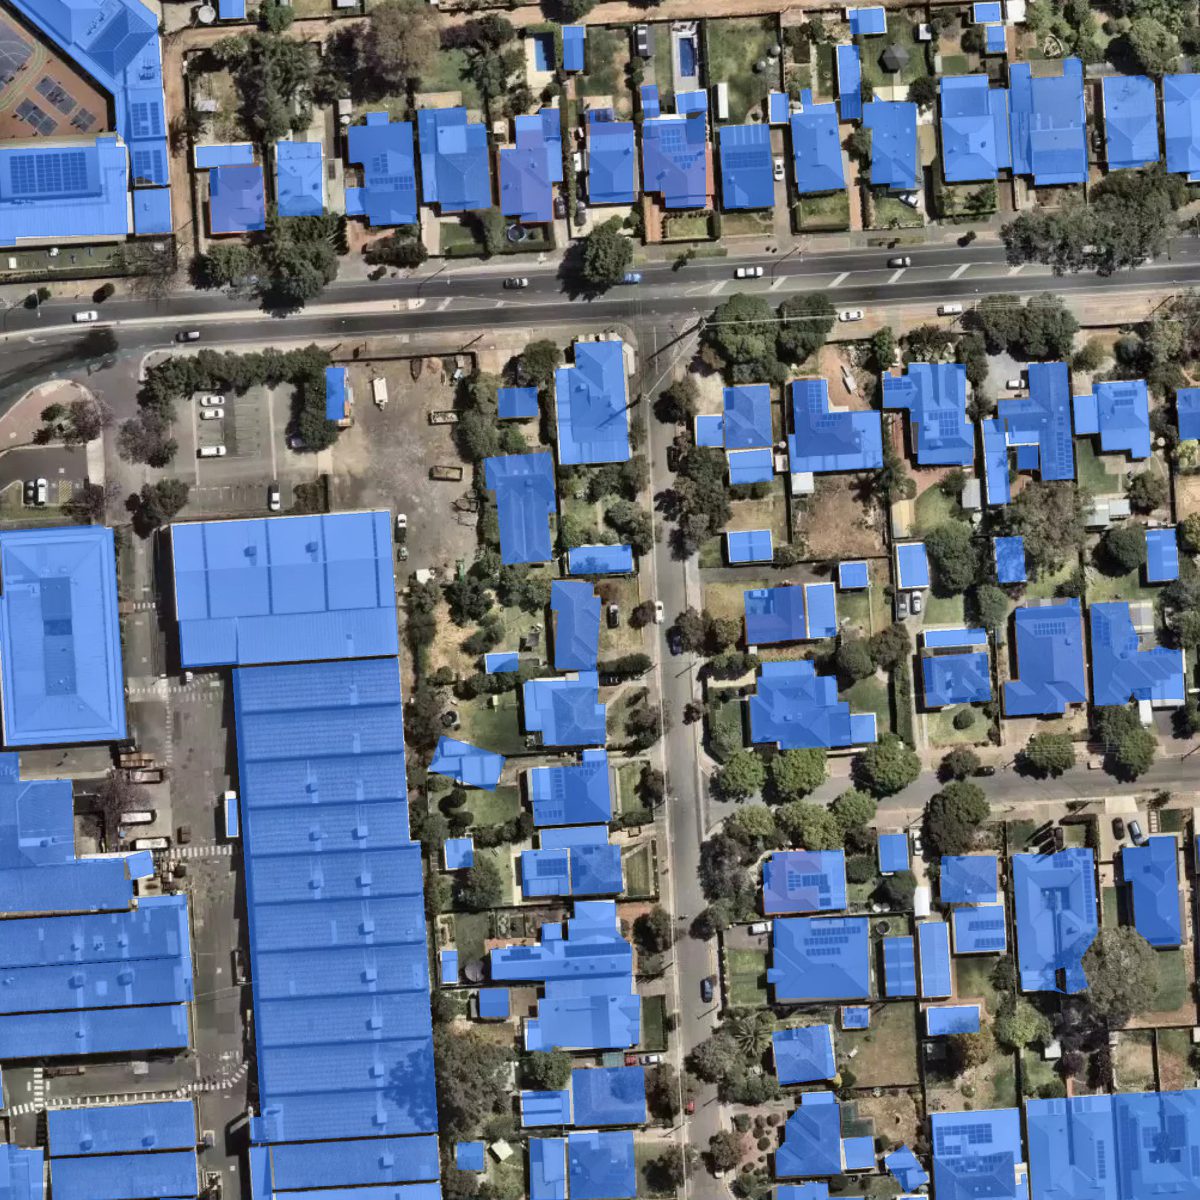
South Africa — Worcester
Model |
IoU |
F1 |
Precision |
Recall |
|---|---|---|---|---|
v.2026-07-06 |
0.592 |
0.744 |
0.867 |
0.651 |
v.2025-12-10 |
0.385 |
0.556 |
0.845 |
0.415 |
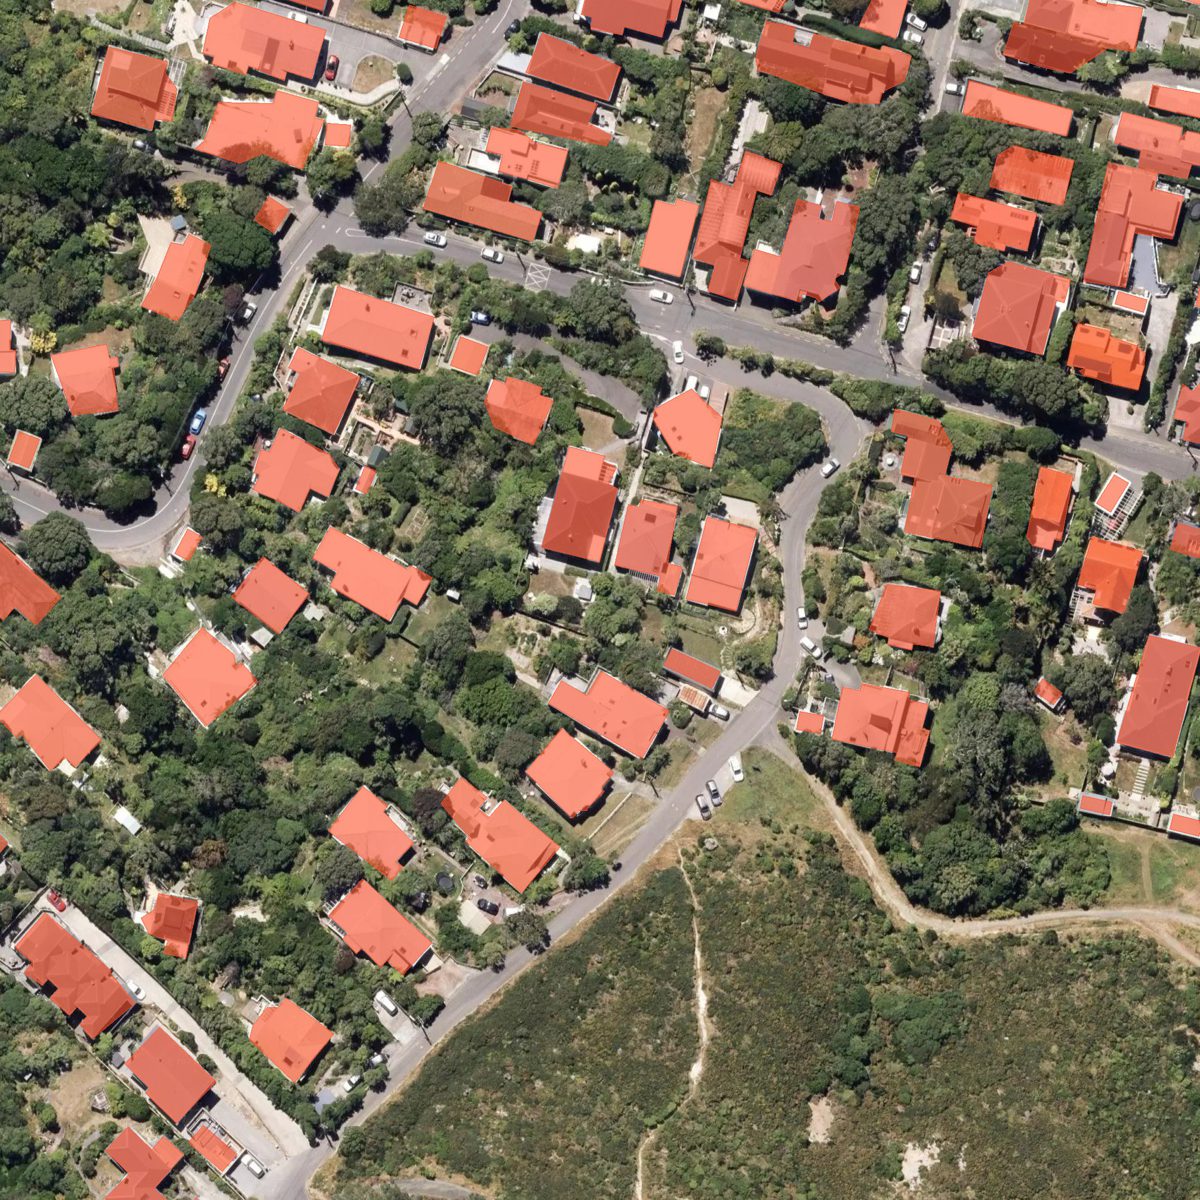
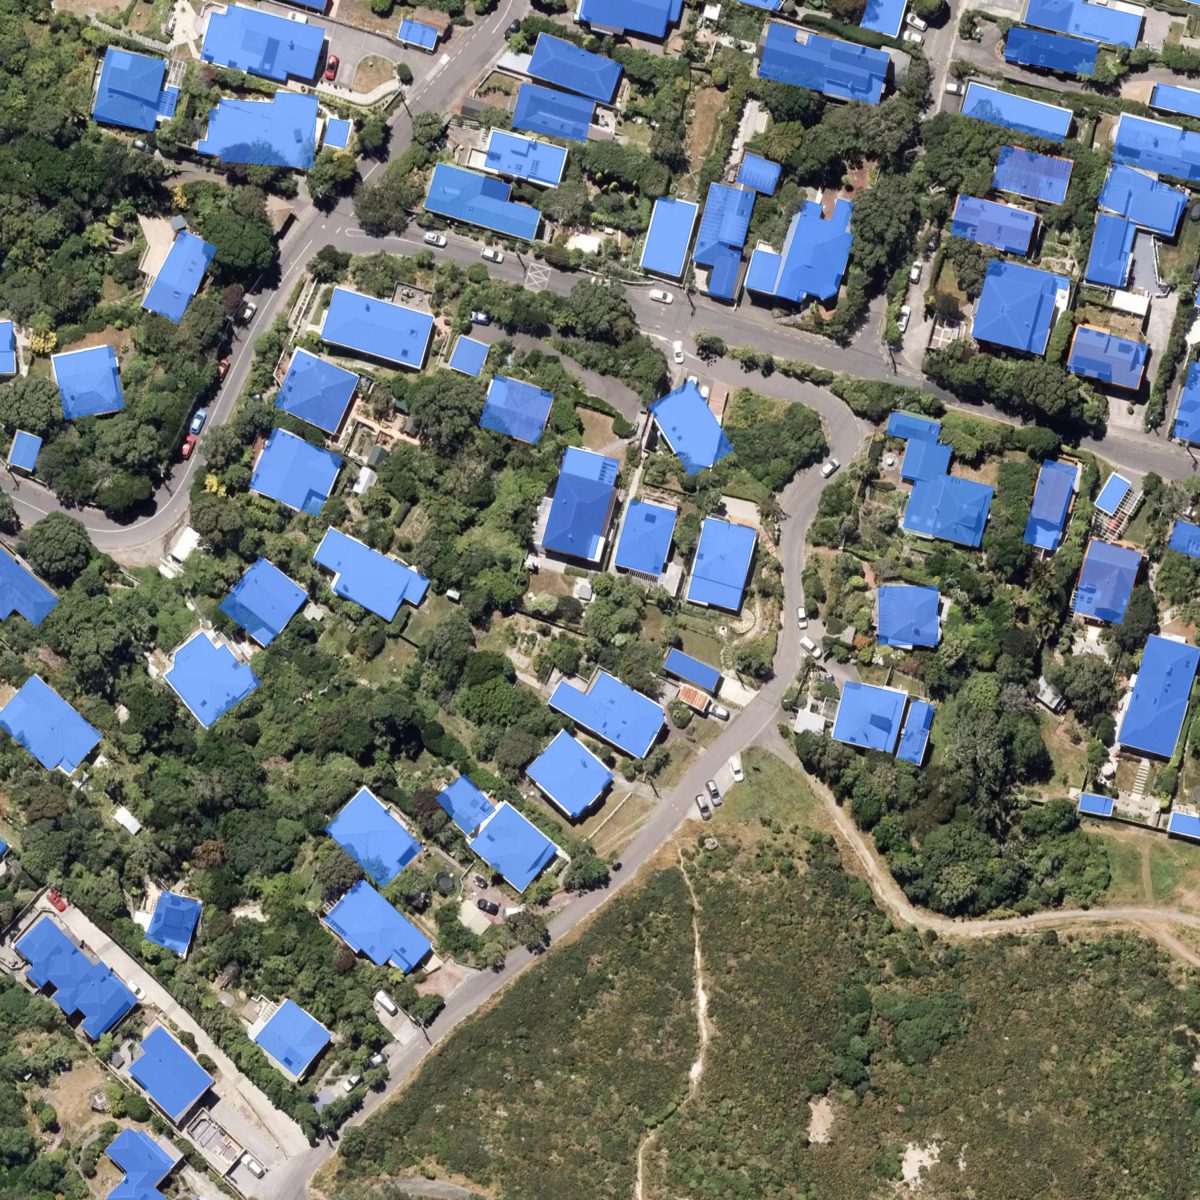
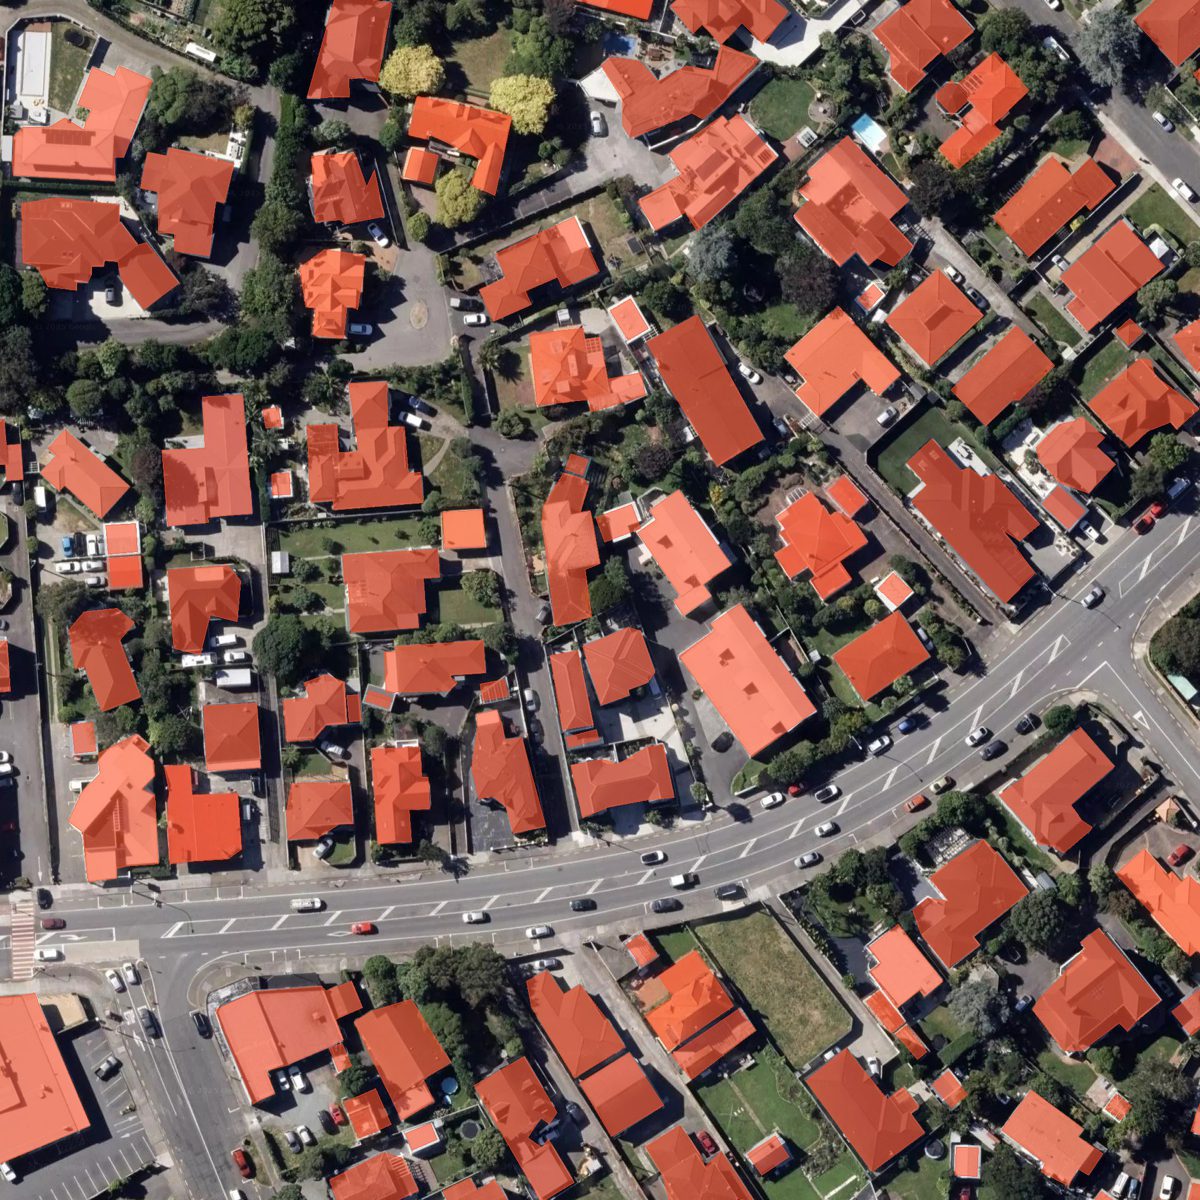
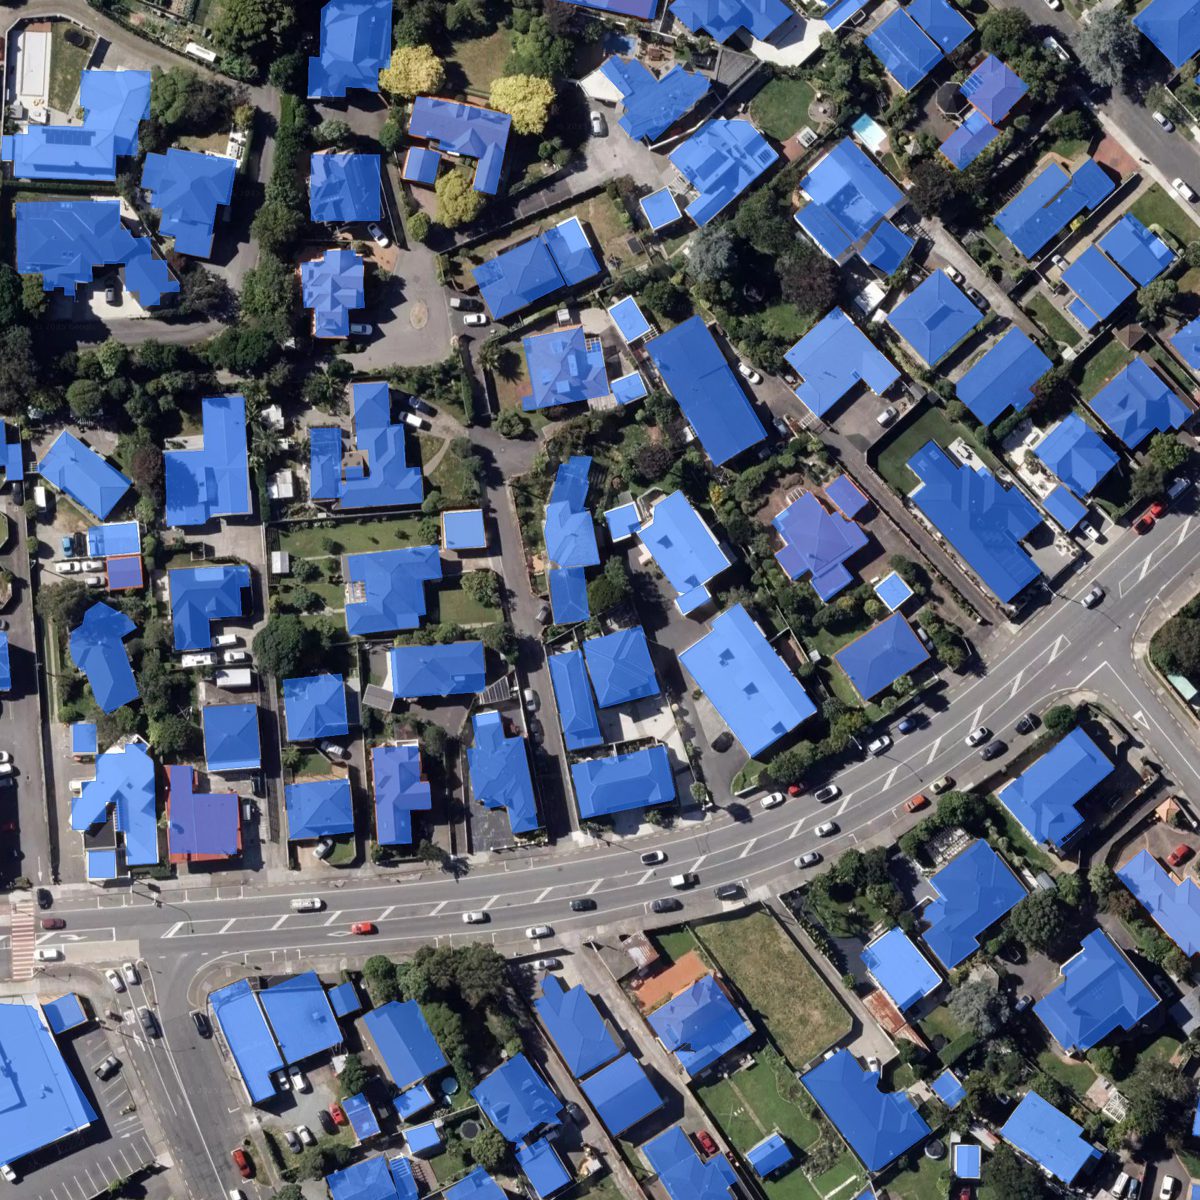
New Zealand — Wellington
Model |
IoU |
F1 |
Precision |
Recall |
|---|---|---|---|---|
v.2026-07-06 |
0.838 |
0.912 |
0.900 |
0.924 |
v.2025-12-10 |
0.790 |
0.883 |
0.888 |
0.878 |
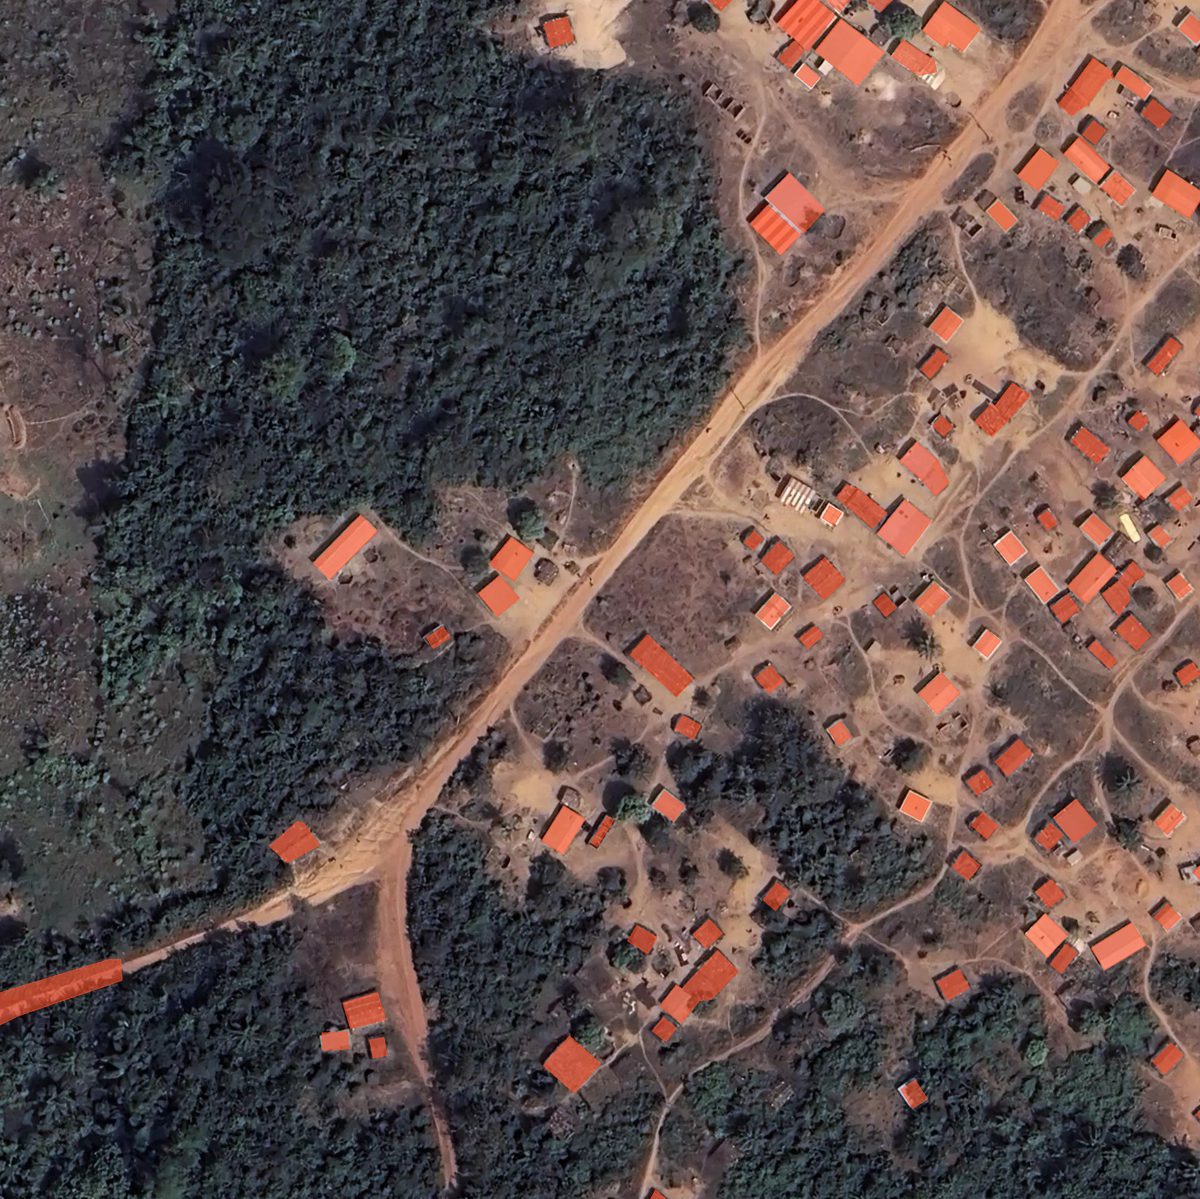
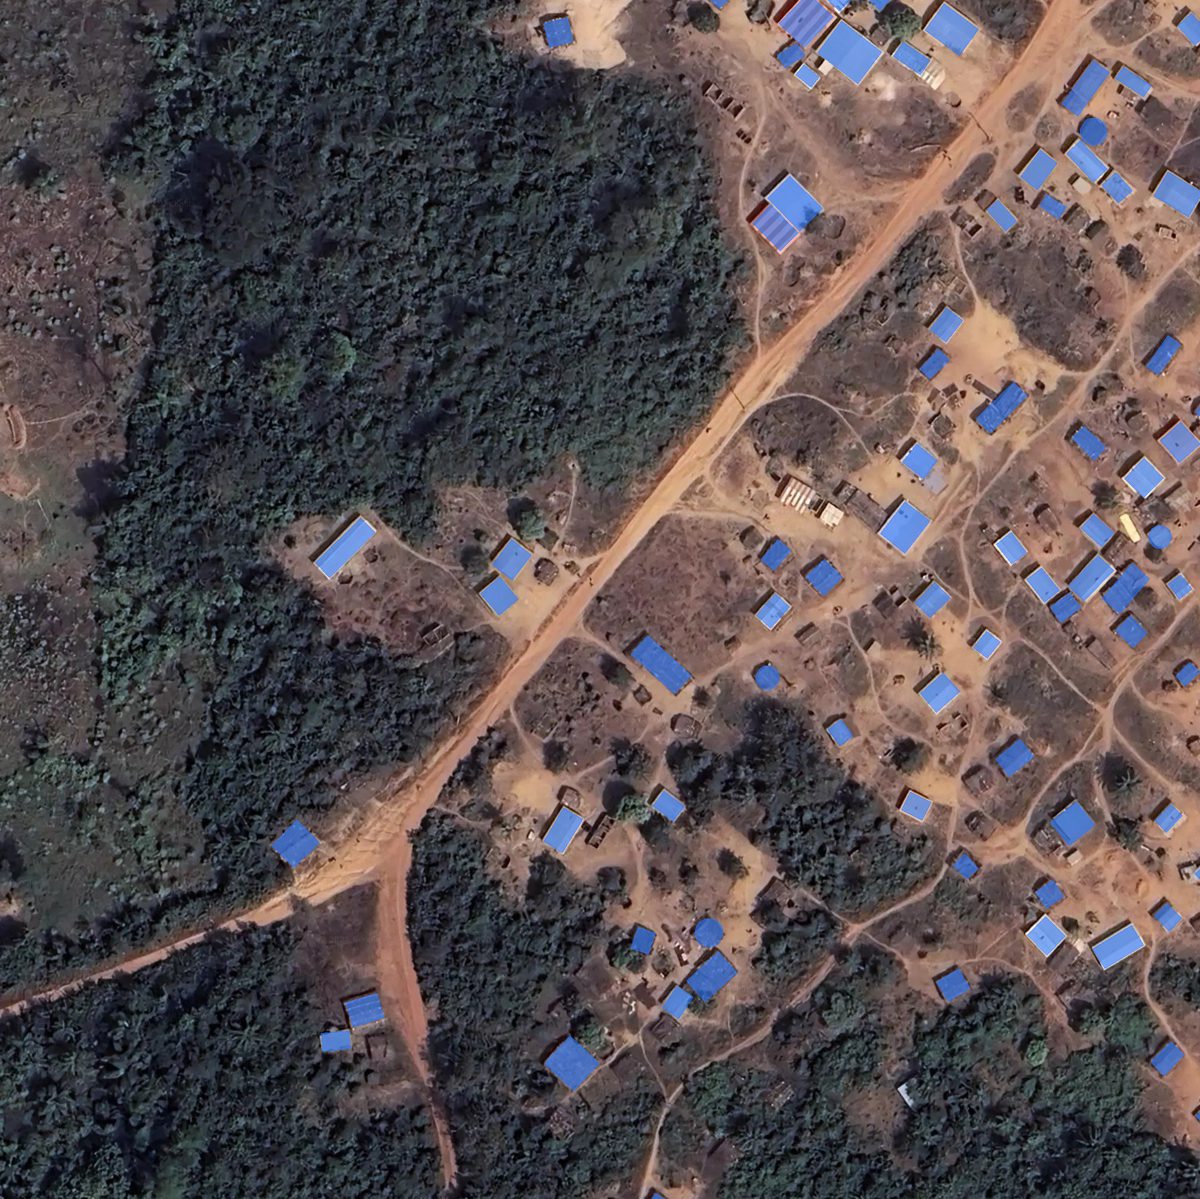
Côte d’Ivoire — Bangolo
Model |
IoU |
F1 |
Precision |
Recall |
|---|---|---|---|---|
v.2026-07-06 |
0.663 |
0.797 |
0.844 |
0.755 |
v.2025-12-10 |
0.642 |
0.782 |
0.927 |
0.676 |
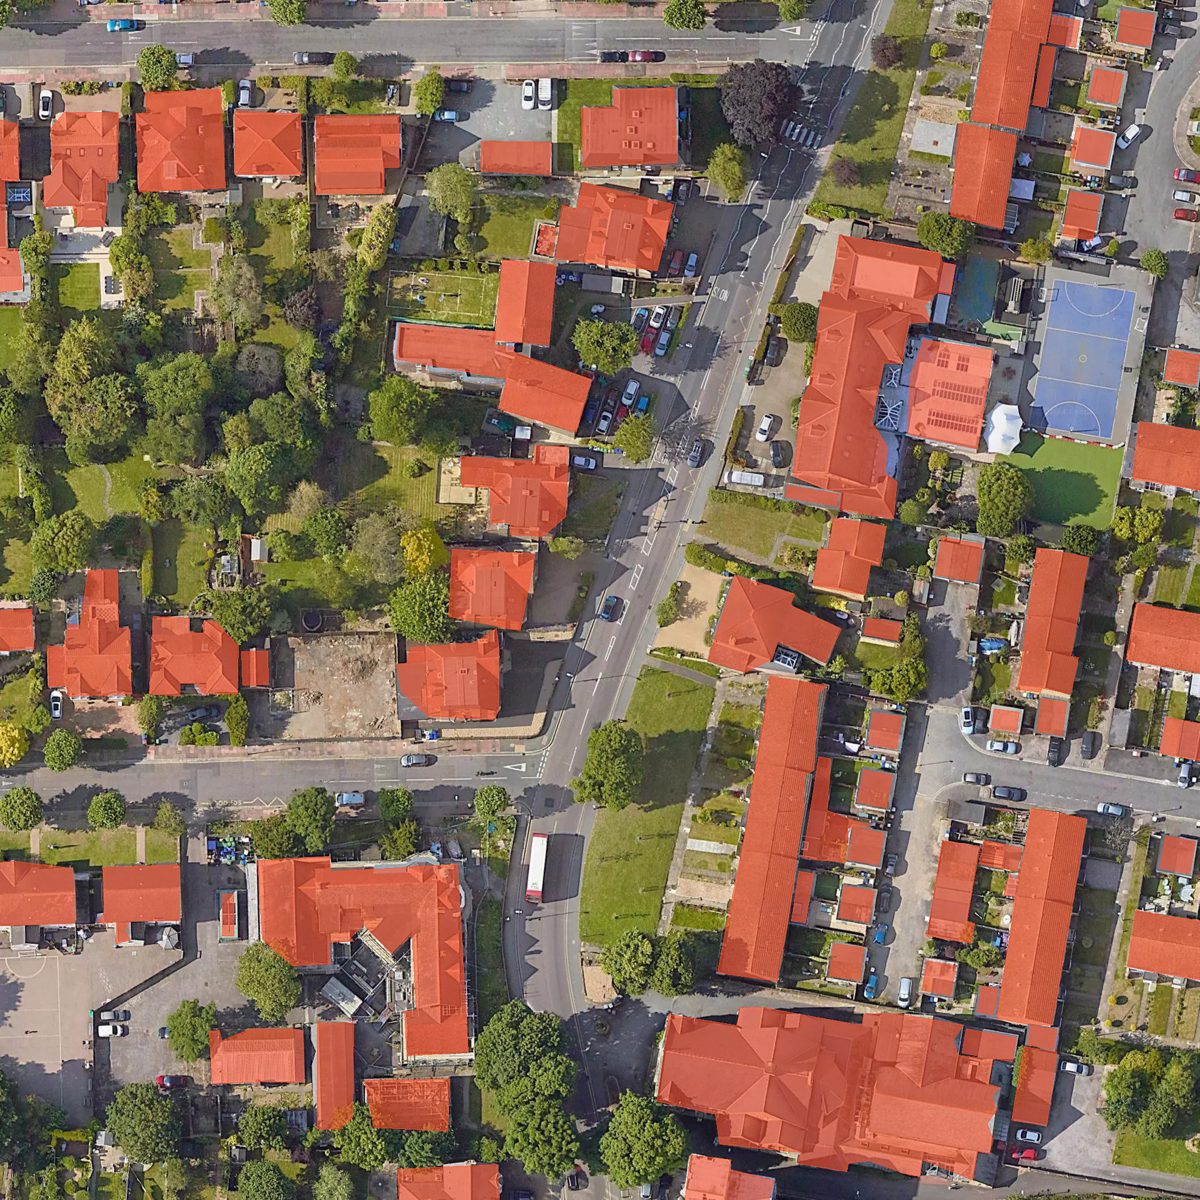
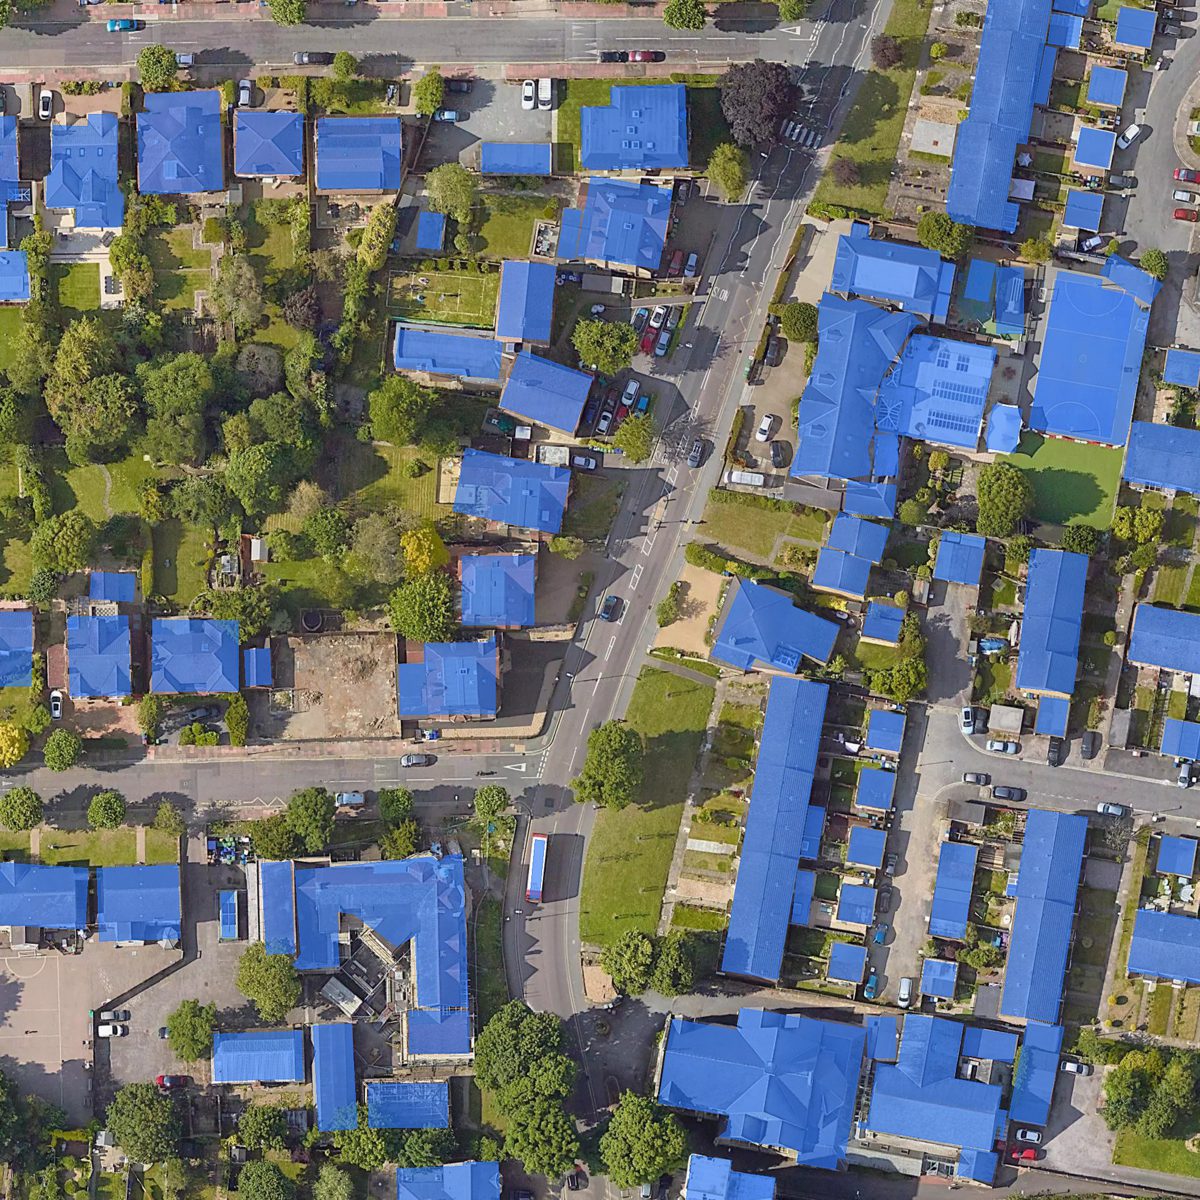
United Kingdom — London
Model |
IoU |
F1 |
Precision |
Recall |
|---|---|---|---|---|
v.2026-07-06 |
0.813 |
0.897 |
0.873 |
0.922 |
v.2025-12-10 |
0.730 |
0.844 |
0.800 |
0.892 |
Australia — Adelaide
Model |
IoU |
F1 |
Precision |
Recall |
|---|---|---|---|---|
v.2026-07-06 |
0.868 |
0.929 |
0.914 |
0.945 |
v.2025-12-10 |
0.830 |
0.907 |
0.899 |
0.915 |
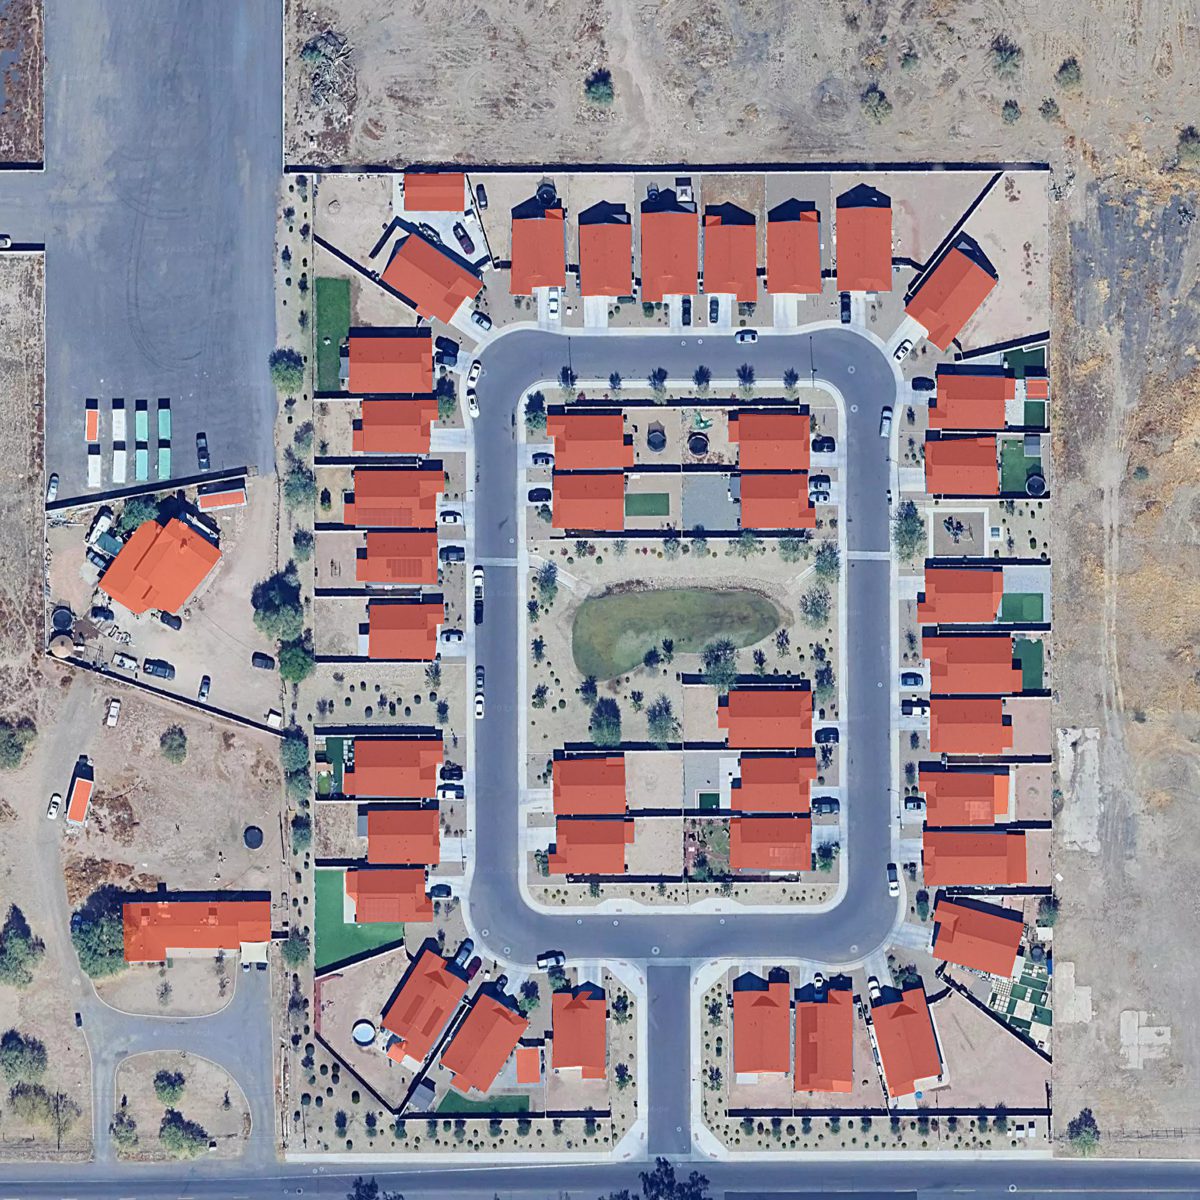
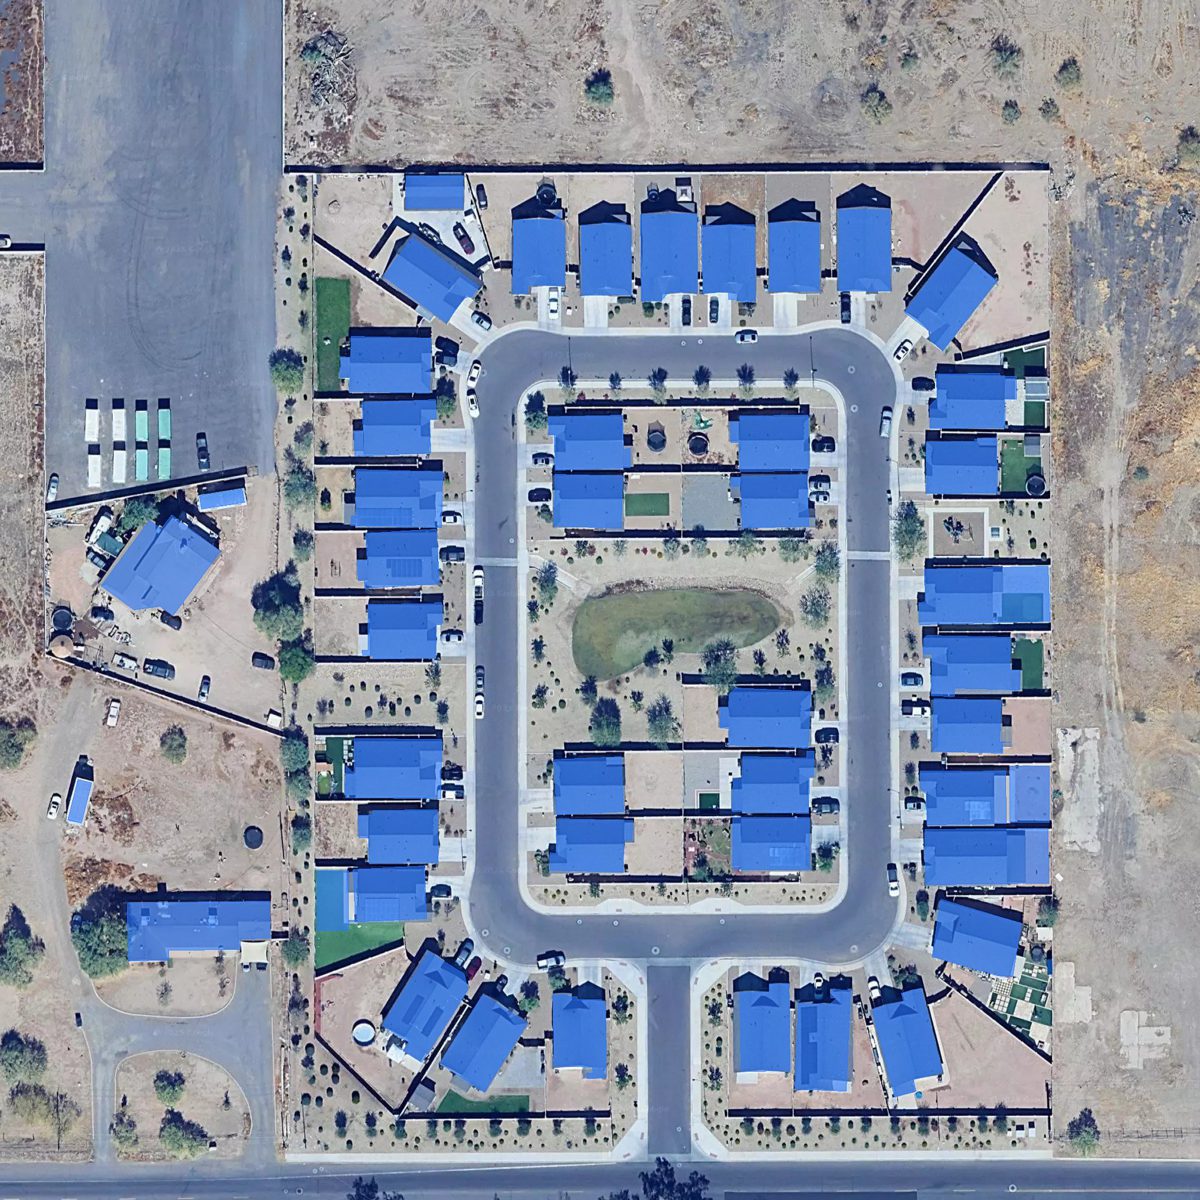
United States — Phoenix
Model |
IoU |
F1 |
Precision |
Recall |
|---|---|---|---|---|
v.2026-07-06 |
0.903 |
0.949 |
0.944 |
0.953 |
v.2025-12-10 |
0.847 |
0.917 |
0.902 |
0.933 |
New Zealand — Lower Hutt
Model |
IoU |
F1 |
Precision |
Recall |
|---|---|---|---|---|
v.2026-07-06 |
0.867 |
0.929 |
0.956 |
0.903 |
v.2025-12-10 |
0.814 |
0.898 |
0.931 |
0.867 |
Satellite imagery validation set
Validation on the global set of satellite imagery across 5 dense urban areas.
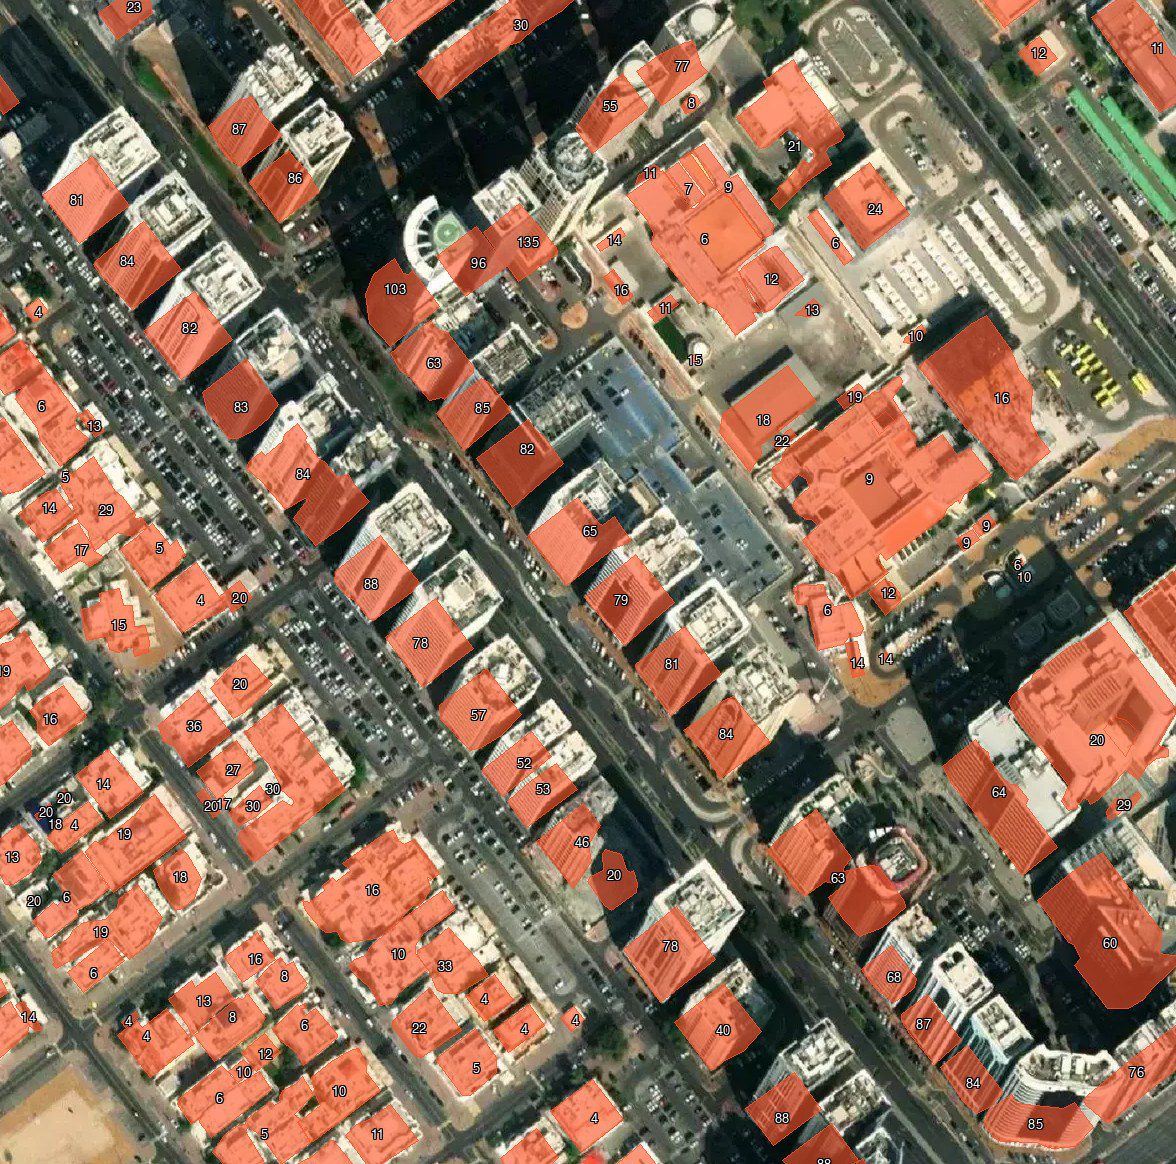
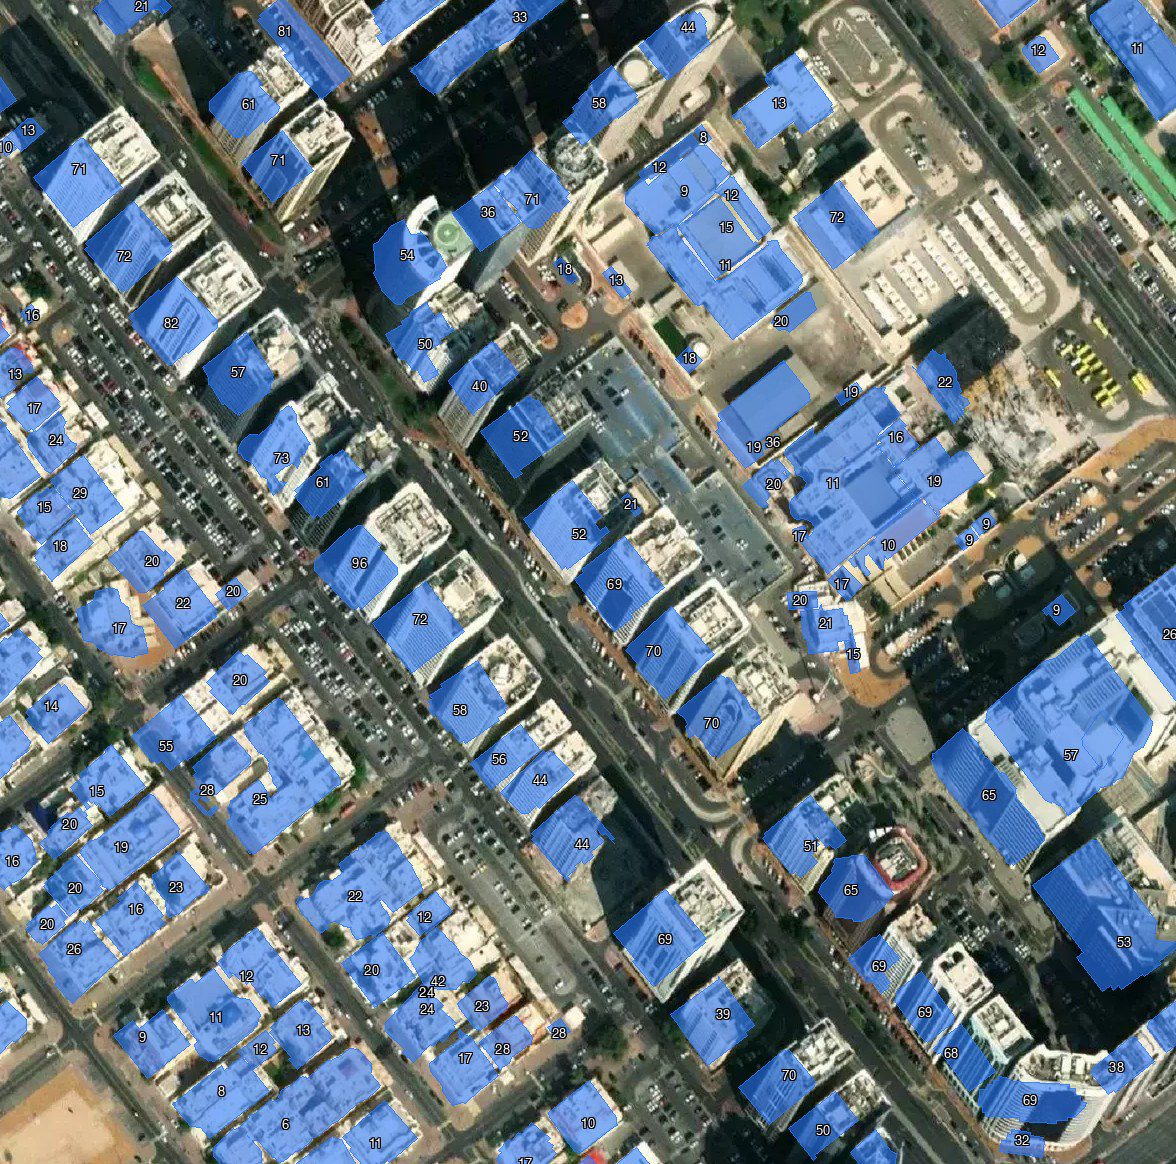
United Arab Emirates — Abu Dhabi
Model |
IoU |
F1 |
Precision |
Recall |
|---|---|---|---|---|
v.2026-07-06 |
0.751 |
0.858 |
0.828 |
0.890 |
v.2025-12-10 |
0.717 |
0.835 |
0.817 |
0.854 |
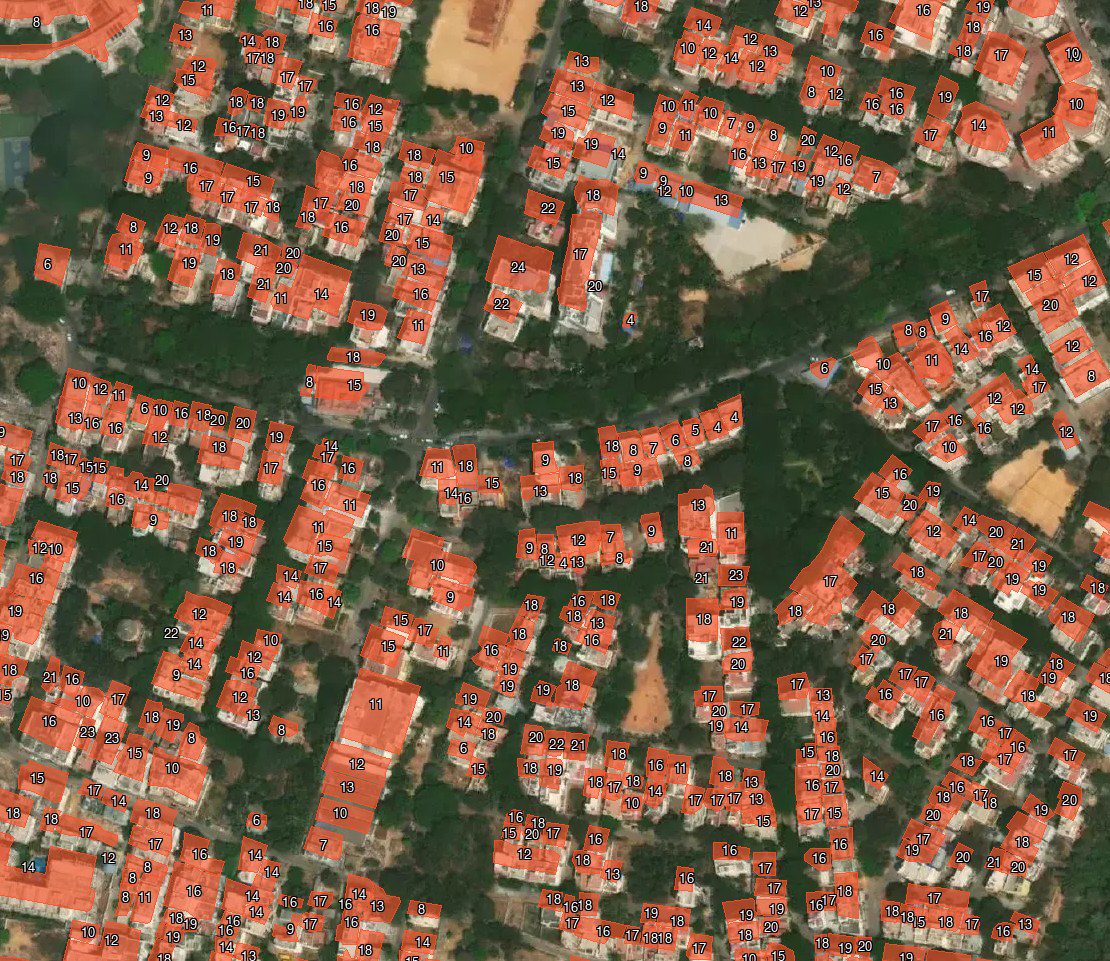
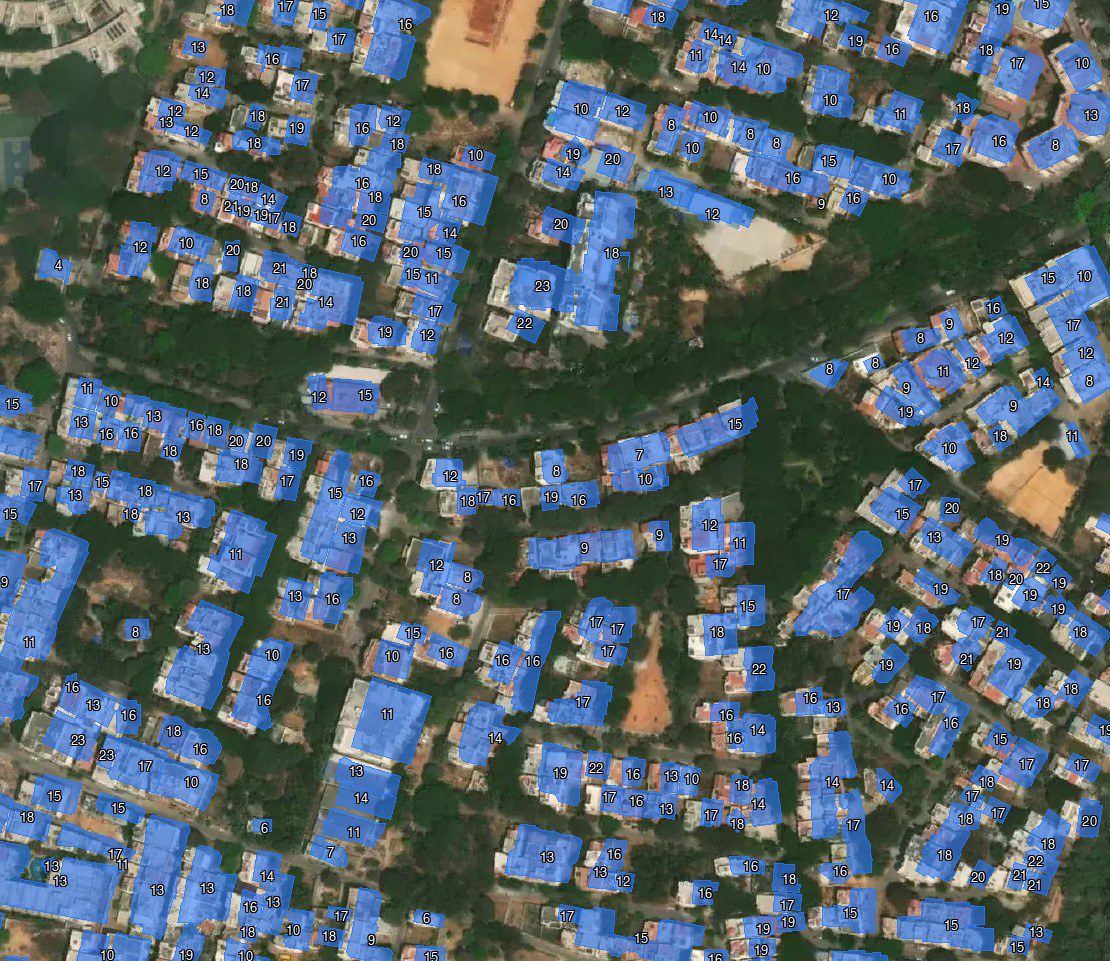
India — Bangalore
Model |
IoU |
F1 |
Precision |
Recall |
|---|---|---|---|---|
v.2026-07-06 |
0.779 |
0.876 |
0.859 |
0.894 |
v.2025-12-10 |
0.735 |
0.847 |
0.848 |
0.846 |
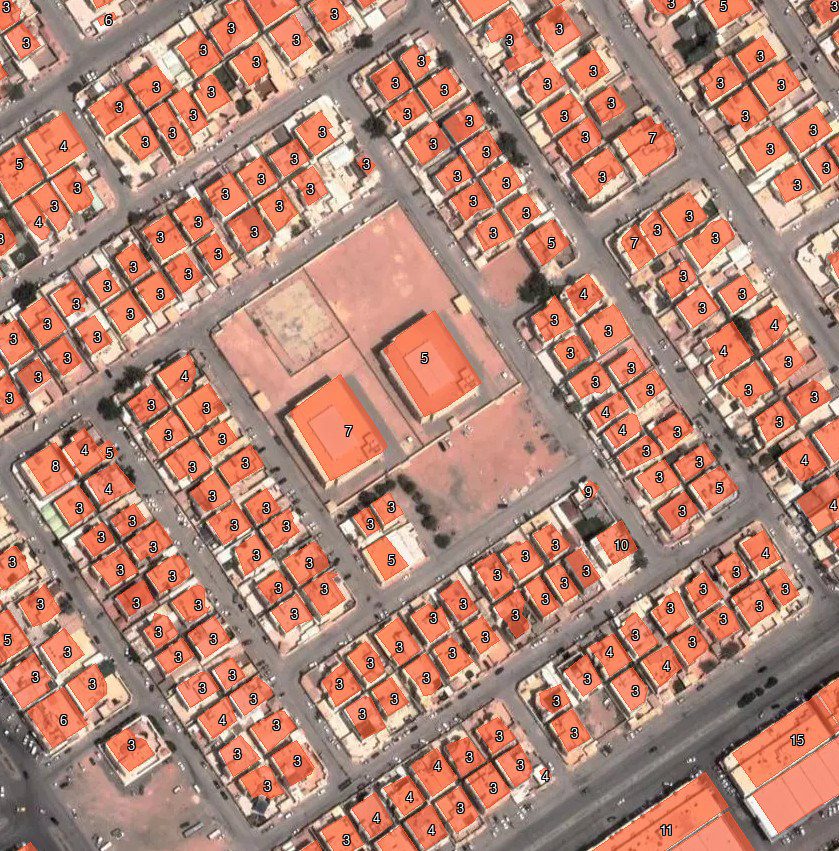
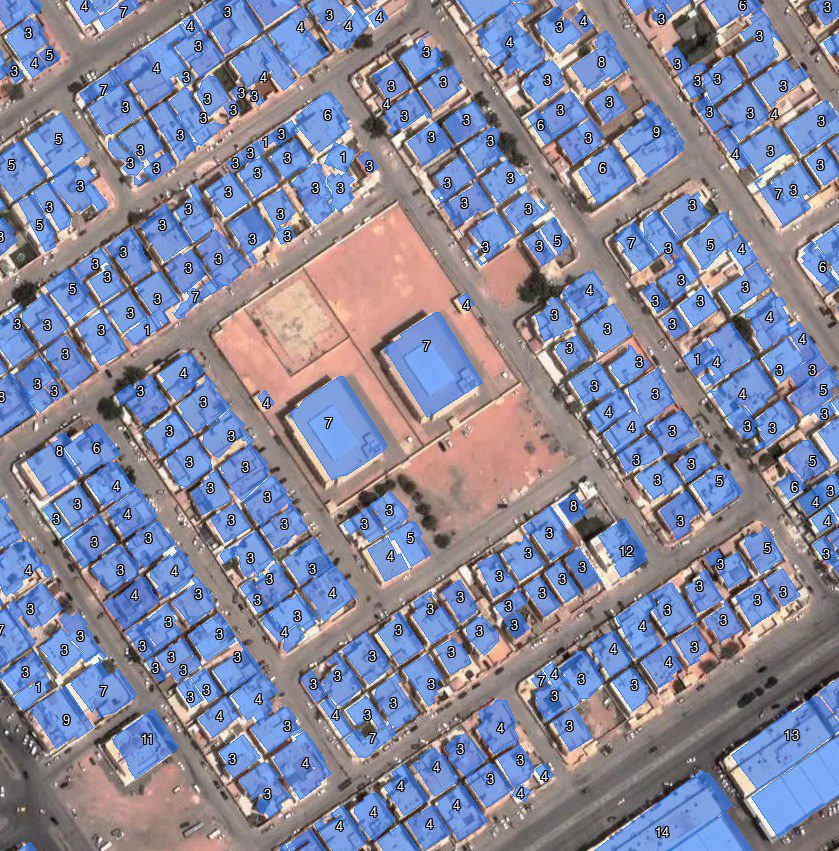
Saudi Arabia — Riyadh
Model |
IoU |
F1 |
Precision |
Recall |
|---|---|---|---|---|
v.2026-07-06 |
0.817 |
0.899 |
0.920 |
0.879 |
v.2025-12-10 |
0.654 |
0.791 |
0.687 |
0.931 |
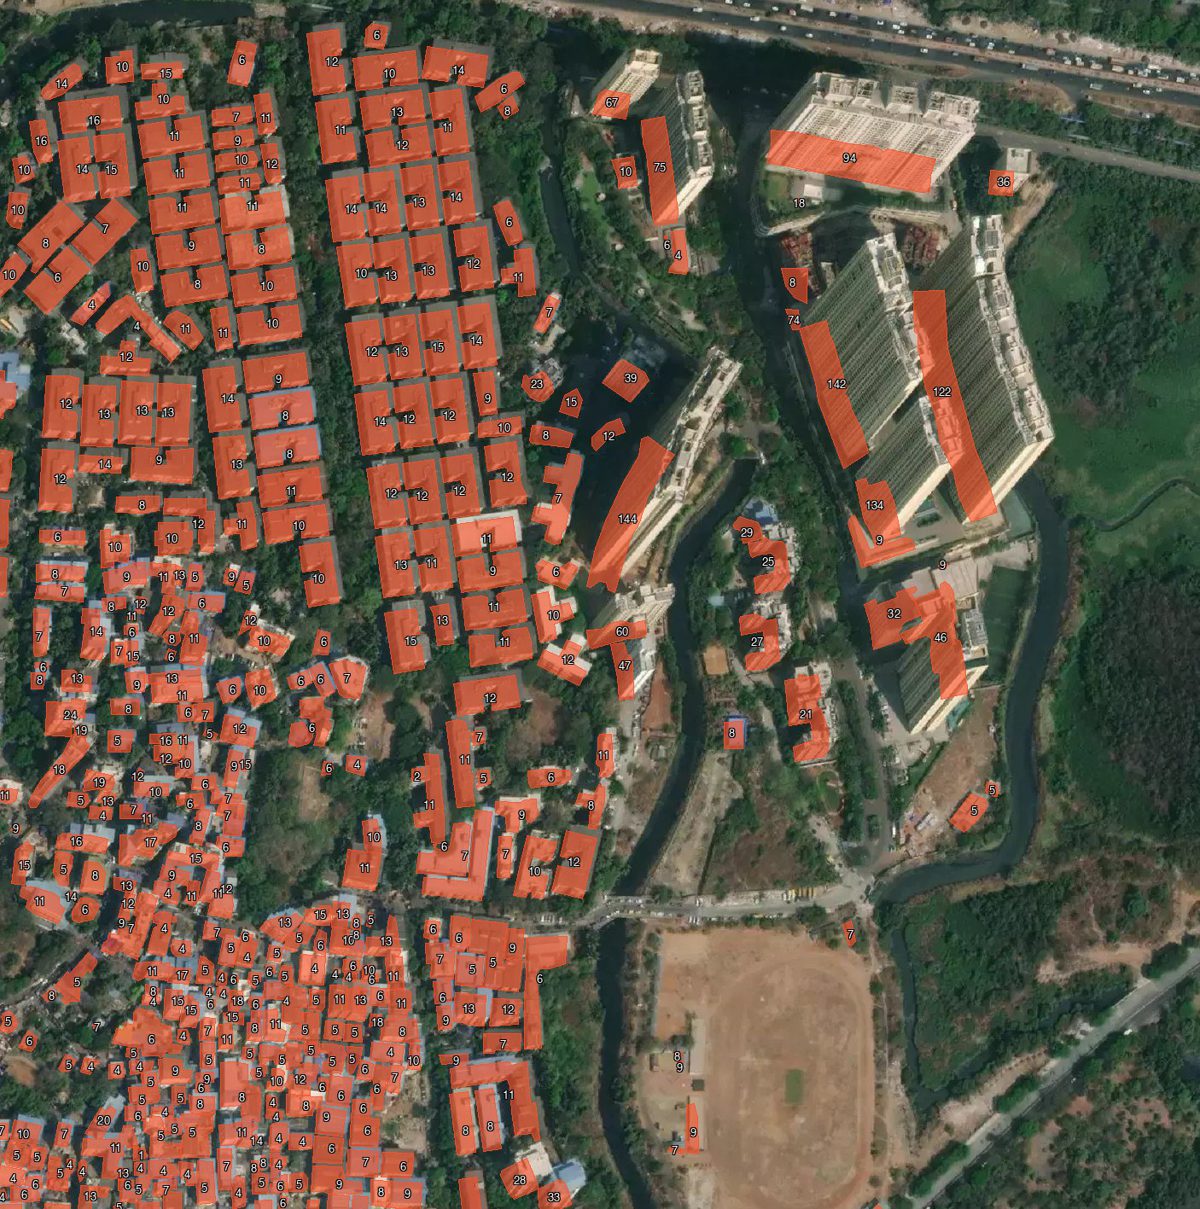
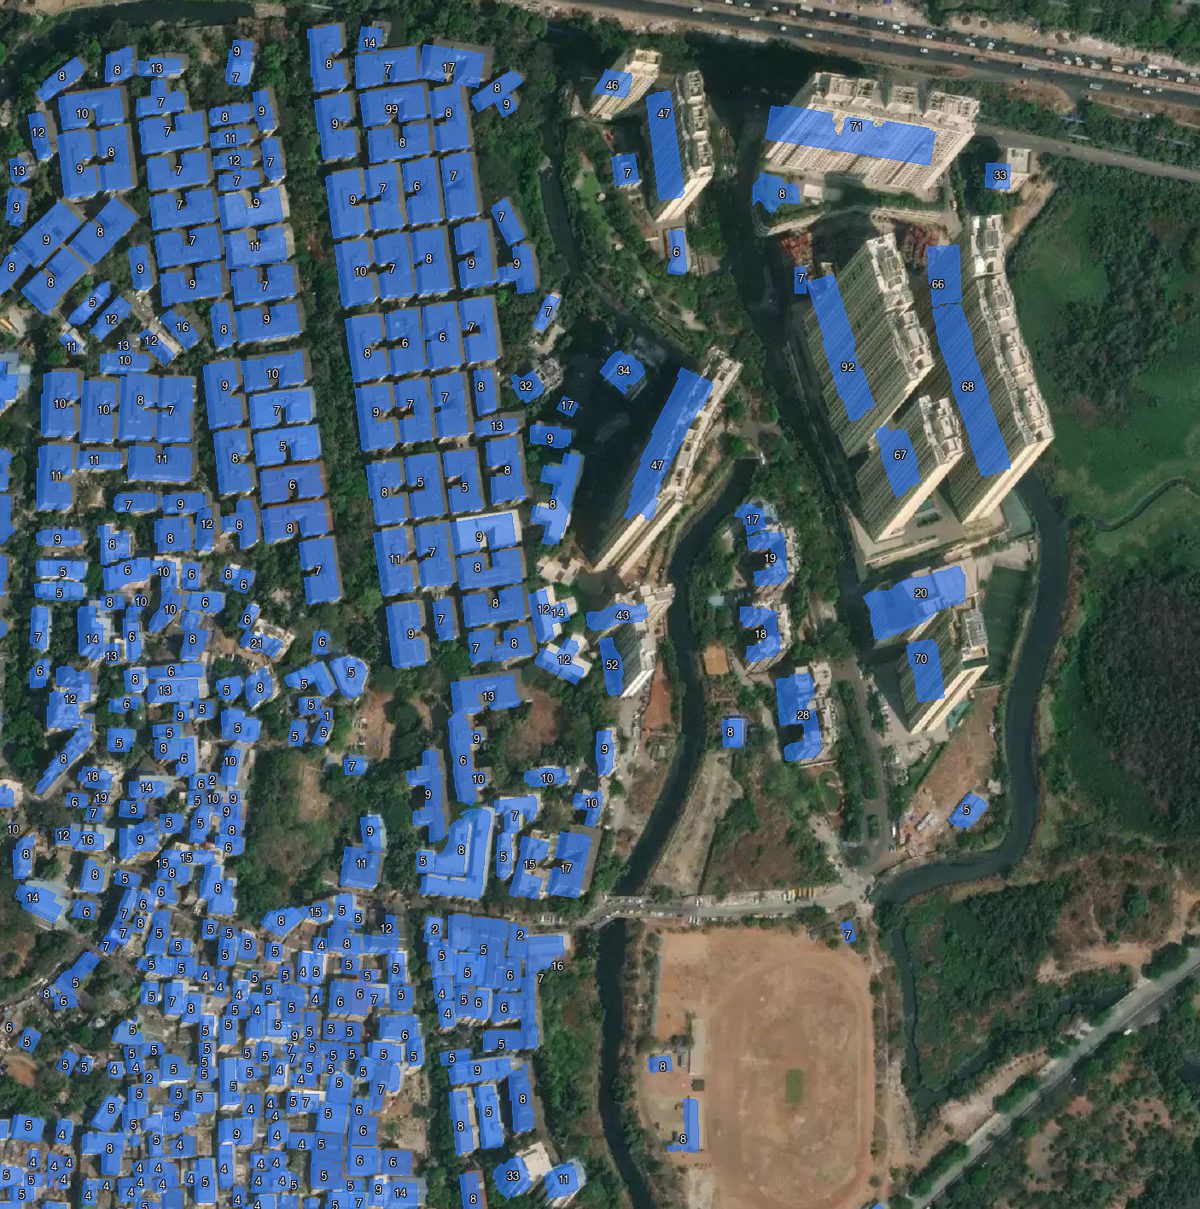
India — Thane
Model |
IoU |
F1 |
Precision |
Recall |
|---|---|---|---|---|
v.2026-07-06 |
0.768 |
0.869 |
0.889 |
0.849 |
v.2025-12-10 |
0.722 |
0.839 |
0.871 |
0.809 |
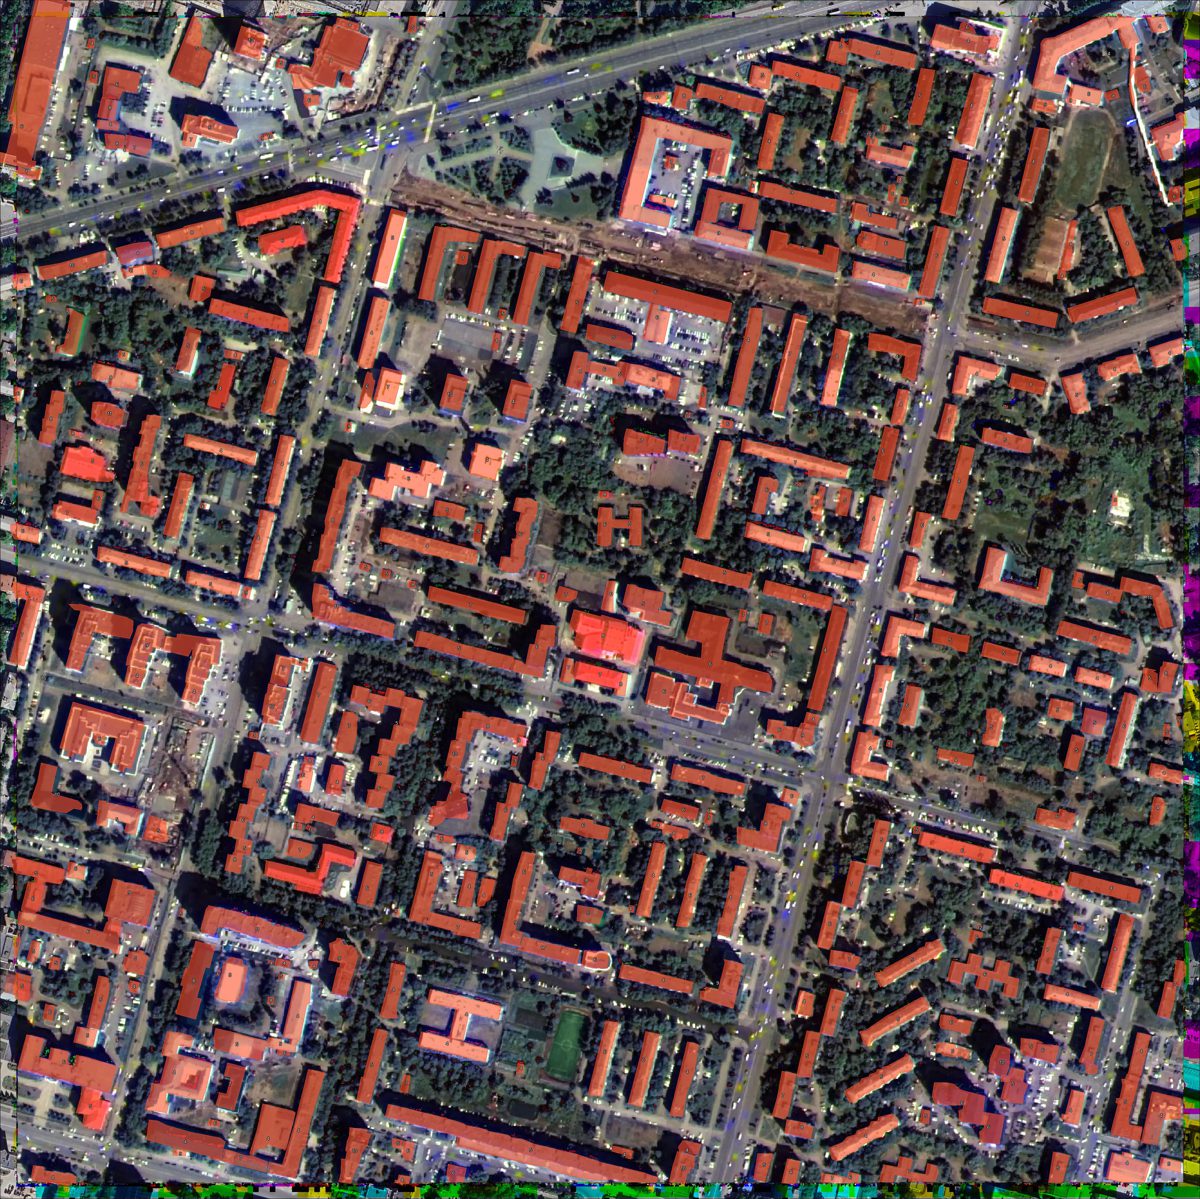
Russia — Ufa
Model |
IoU |
F1 |
Precision |
Recall |
|---|---|---|---|---|
v.2026-07-06 |
0.821 |
0.902 |
0.897 |
0.907 |
v.2025-12-10 |
0.818 |
0.900 |
0.897 |
0.903 |

Summary
v.2026-07-06 leads the previous production model on F1 in all 14 AOIs. On the global validation set of aerial imagery (9 AOIs) the mean area-based F1 rises from 0.849 to 0.893 (IoU 0.751 → 0.813); on the 5 dense-urban satellite imagery AOIs the mean F1 rises from 0.842 to 0.881 (IoU 0.729 → 0.787), driven mainly by higher recall and precision in informal and high-density built-up areas such as Riyadh, Bangalore and Thane.