森林和树木
树木和植被 默认模型
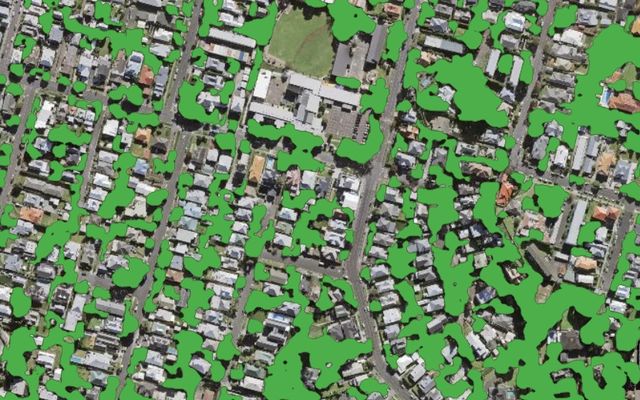
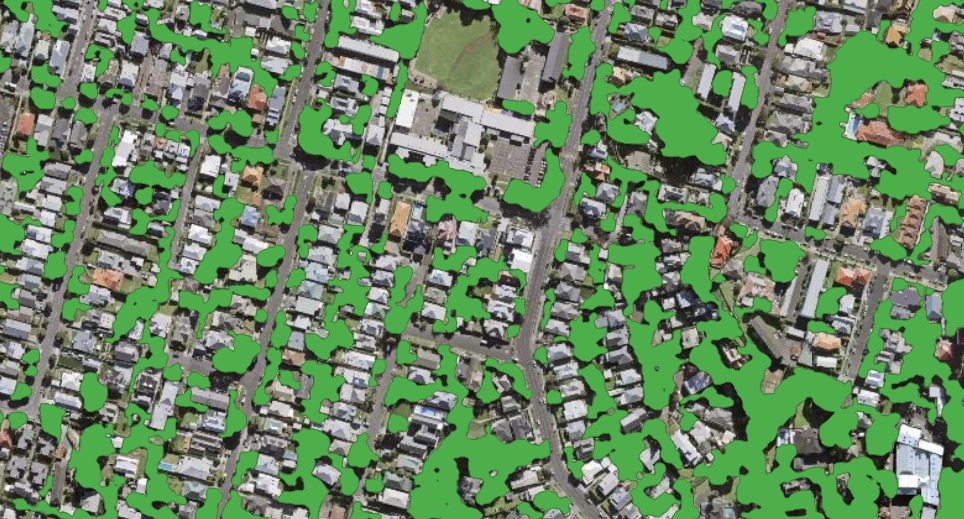
示例结果:树木和灌木覆盖掩膜。
费用
每 km² 8 积分 + 影像
示例:Mapbox 缩放级别 18 下 10 km² ≈ 110 积分。
分割所有被树木和灌木覆盖的区域,包括疏林和灌丛。适用于大多数环境,包括城市。高度分级和单棵树冠是启动运行时可开启的选项。
输出结果
树木和灌木覆盖多边形图层。
最佳适用影像
生长季拍摄的 0.6–0.15 米影像(缩放级别 18–20)。无叶或被雪覆盖的树木无法识别。
使用示例
按区或地块测算树冠覆盖率
对比两个日期,发现被砍伐的森林
建立城市绿地清单
- 版本
2026-07-03
- 地理范围
全球的
- 方法
分割
- GSD / 缩放级别
0.6–0.15 m / z18–20
该模型基于不同地区和气候带的 0.6–0.3 米影像训练,分辨率足以识别小片树丛和狭窄树行。请使用生长季影像:无叶树木和被雪覆盖的植被不属于目标类别。
使用此模型的场景
每个场景都是开启了某一选项的森林和树木模型。可在 Mapflow Web 或 QGIS 插件的运行表单中选择选项。
默认运行
所有树木和灌木覆盖,细至小片树丛和成排树木。
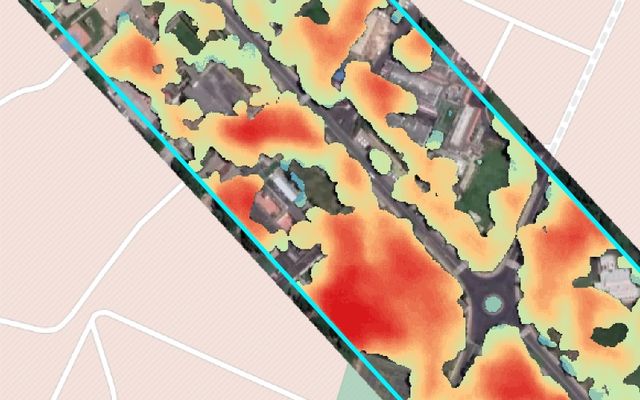
+ 高度分级
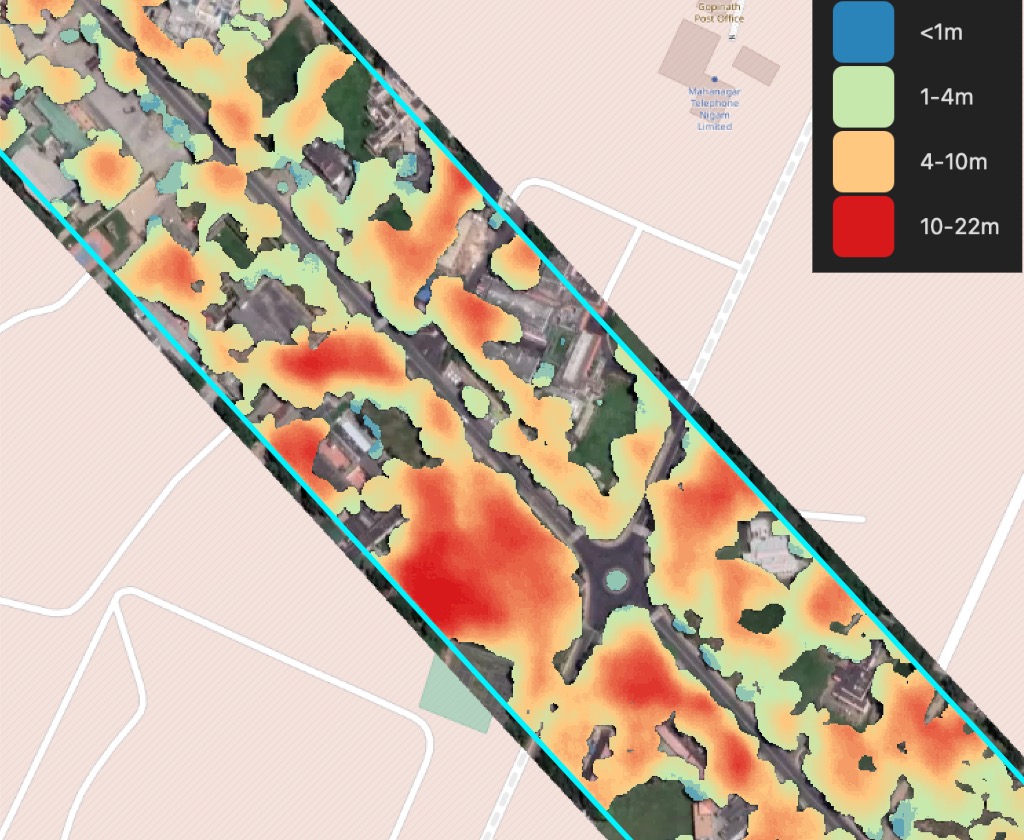
植被分为灌木、4–10 米森林和 10 米以上森林。
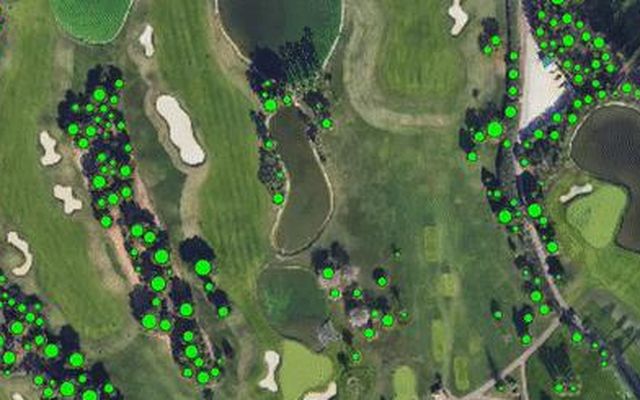
+ 树冠
每个树冠一个点,包括独立树木。
输电线路沿线植被高度
森林和树木 + 高度分级
费用
每 km² 18 积分 + 影像
示例:Mapbox 缩放级别 18 下 10 km² ≈ 210 积分。
运行带高度估算的森林模型。植被分为 4 米以下灌木、4–10 米森林和 10 米以上森林,正是输电线路附近植被管理所需的分级。
输出结果
带高度等级的植被多边形。
最佳适用影像
生长季拍摄的 0.6–0.3 米影像(缩放级别 18–19)。
使用示例
确定输电线路走廊清障作业的优先级
按高度等级规划线路通道维护
排查公路和铁路沿线植被
提示。 在 QGIS 中为线图层创建缓冲区(矢量 › 地理处理工具 › 缓冲区),并将缓冲区用作处理区域,这样只需为走廊付费。
注解
高度等级:
低于 4 米的灌木;
4 至 10 米的森林;
高于 10 米的森林。
这些等级可为输电线路走廊及类似区域的植被管理提供支持,请参阅 Geoalert 专业解决方案。阈值可根据您的需求定制。
统计单棵树木
森林和树木 + 树冠
费用
每 km² 13 积分 + 影像
示例:Mapbox 缩放级别 19 下 10 km² ≈ 220 积分。
从森林和单株树木中提取树冠,输出为带树冠半径的点或树冠多边形。
输出结果
带半径的树冠点,或树冠多边形。
最佳适用影像
使用 0.3 米影像(缩放级别 19)以区分单棵树木。
使用示例
行道树和公园树木清查
统计果园和种植园的树木数量
跟踪施工场地的树木损失
重要
如需识别单棵树木,请使用 0.3 米影像(约缩放级别 19)并开启 树冠 选项。
所有选项
示例结果
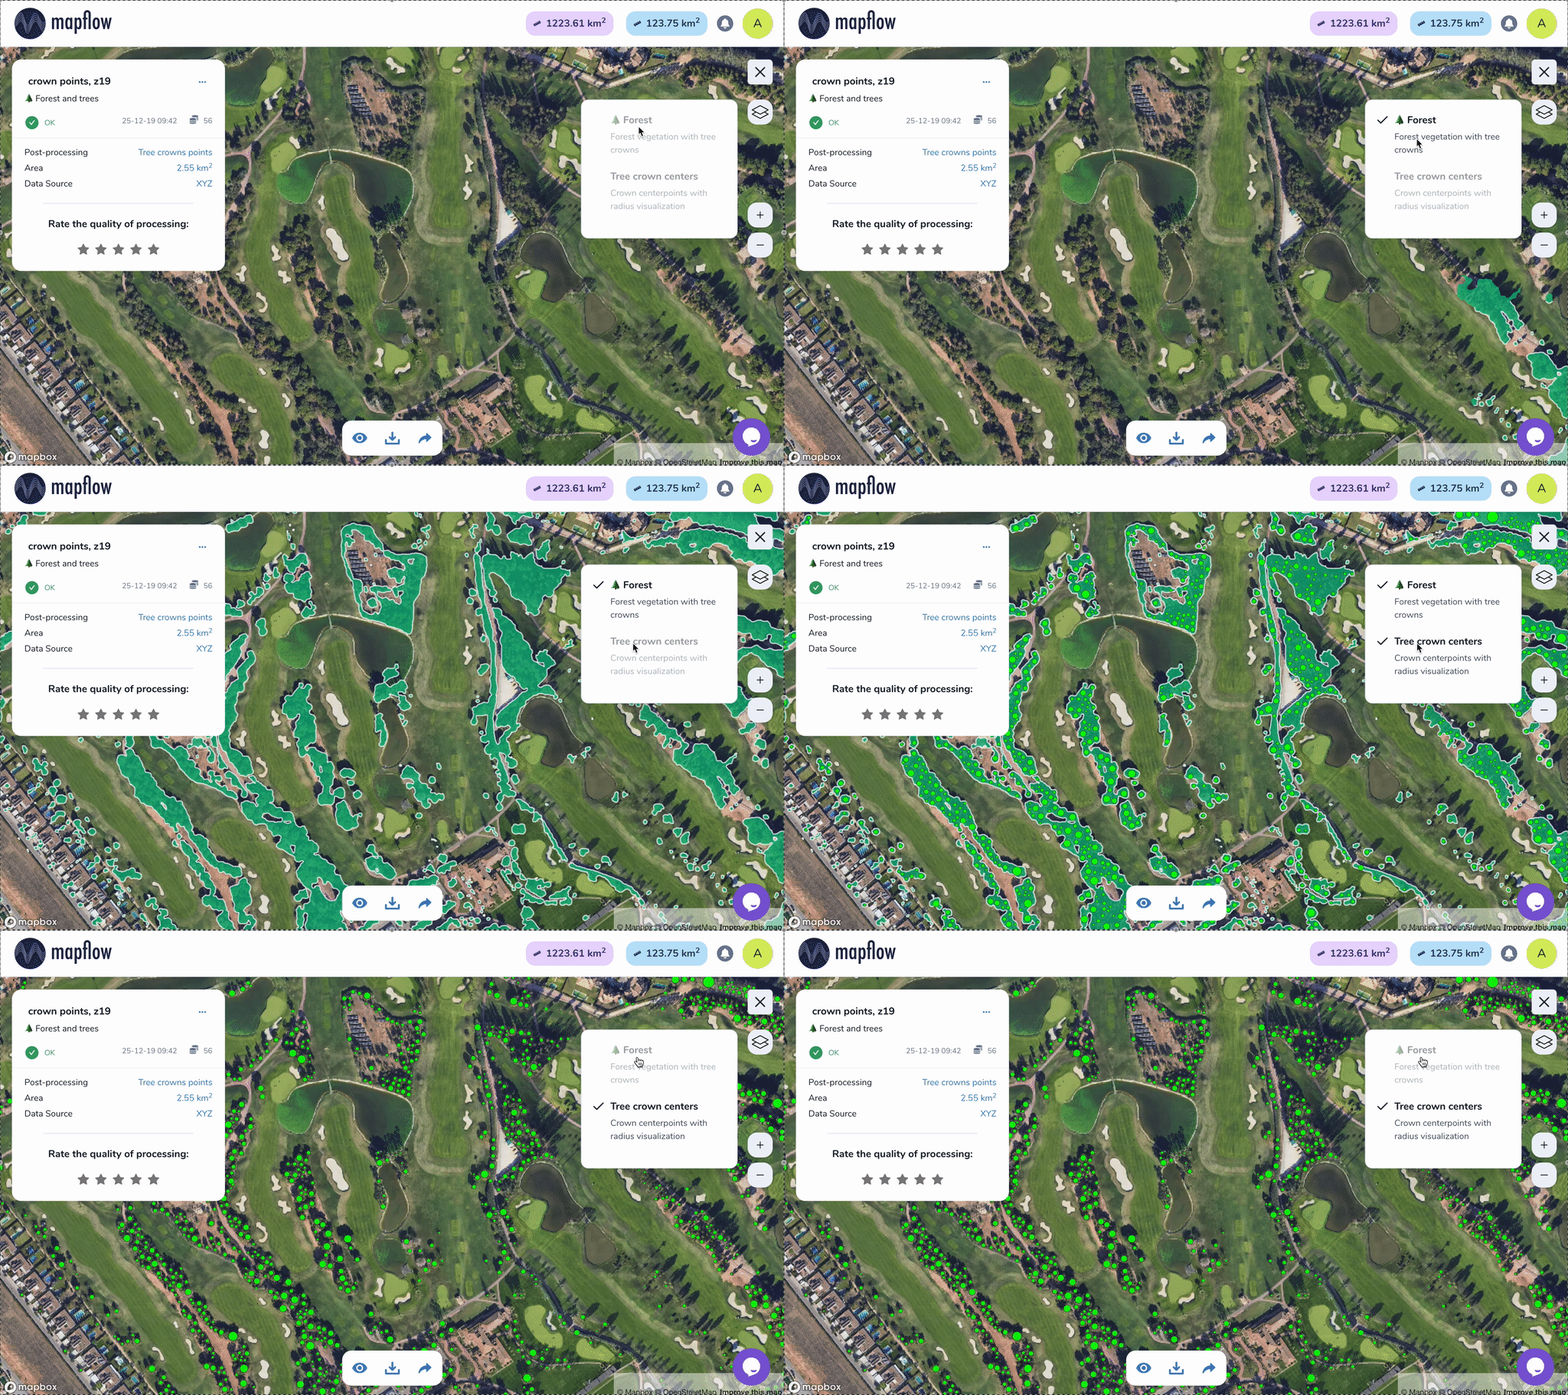
📊 Benchmarks
Forest and trees v.2026-09-10 (Global, segmentation) was evaluated on 8 areas of interest against manually annotated ground truth. Metrics are area-based: IoU is the intersection-over-union of the predicted and ground-truth vegetation masks, and F1, precision and recall are computed on the overlapping mask area. The v.2026-09-10 update refines tree-crown extraction results.
AOI(位置) |
预测特征 |
IOU |
F1 |
精确 |
记起 |
|---|---|---|---|---|---|
意大利 — 克罗托内 |
第254章 |
0.862 |
0.926 |
0.944 |
0.909 |
西班牙 — 马德里 |
第368章 |
0.813 |
0.897 |
0.880 |
0.915 |
菲律宾 — 巴兰加 |
220 |
0.806 |
0.892 |
0.864 |
0.923 |
西班牙 — 贝利利亚德圣安东尼奥 |
1070 |
0.784 |
0.879 |
0.894 |
0.864 |
西班牙 — 昆卡 |
409 |
0.763 |
0.865 |
0.859 |
0.872 |
乌兹别克斯坦 — 塔什干 |
156 |
0.730 |
0.844 |
0.905 |
0.791 |
西班牙 — 罗斯 |
249 |
0.617 |
0.763 |
0.699 |
0.841 |
阿根廷 — 拉班达 |
93 |
0.576 |
0.731 |
0.653 |
0.829 |
全球(8 个 AOI 的平均值) |
2819 |
0.744 |
0.850 |
0.837 |
0.868 |
Area-based IoU / F1 / Precision / Recall measured against ground-truth vegetation masks; segmentation evaluation run 2026-07-03 (unchanged in v.2026-09-10). Compared with the previous version v.2025-06-14 (mean F1 0.513, IoU 0.396).
参见
📊 See per-location segmentation benchmark details (v.2026-09-10) for the area-by-area breakdown, the comparison with the previous version and prediction-vs-ground-truth overlays.
Benchmarks - tree crowns
Latest update — 🌲 Forest and trees v.2026-09-10 (tree crown polygons). The crown-polygon output was evaluated on 7 areas of interest (AOI) against manually annotated ground truth. Metrics are area-based on the crown masks: IoU is the intersection-over-union of the predicted and ground-truth crown masks, and F1 / Precision / Recall are computed on the overlapping mask area.
AOI(位置) |
Predicted crowns |
IOU |
F1 |
精确 |
记起 |
|---|---|---|---|---|---|
意大利 — 克罗托内 |
第254章 |
0.842 |
0.914 |
0.930 |
0.898 |
西班牙 — 马德里 |
398 |
0.823 |
0.903 |
0.907 |
0.899 |
菲律宾 — 巴兰加 |
309 |
0.780 |
0.876 |
0.849 |
0.904 |
西班牙 — 昆卡 |
433 |
0.732 |
0.846 |
0.875 |
0.818 |
西班牙 — 贝利利亚德圣安东尼奥 |
1134 |
0.694 |
0.819 |
0.855 |
0.786 |
西班牙 — 罗斯 |
239 |
0.689 |
0.816 |
0.759 |
0.883 |
阿根廷 — 拉班达 |
111 |
0.624 |
0.769 |
0.700 |
0.852 |
Global (mean of 7 AOIs) |
2878 |
0.741 |
0.849 |
0.839 |
0.863 |
Area-based IoU / F1 / Precision / Recall measured on tree-crown polygon masks; evaluation run 2026-10-01. Compared with the previous version v.2026-07-03 (mean F1 0.824, IoU 0.706).
Tree count accuracy. For tree-counting use cases we also track how closely the number
of detected crown polygons matches the ground-truth crown count. Relative count error is
|detected − ground truth| / ground truth.
AOI(位置) |
GT crowns |
v.2026-09-10 detected (count err) |
v.2026-07-03 detected (count err) |
|---|---|---|---|
意大利 — 克罗托内 |
327 |
254 (22.3%) |
254 (22.3%) |
西班牙 — 马德里 |
478 |
398 (16.7%) |
368 (23.0%) |
菲律宾 — 巴兰加 |
193 |
309 (60.1%) |
220 (14.0%) |
西班牙 — 昆卡 |
321 |
433 (34.9%) |
409 (27.4%) |
西班牙 — 贝利利亚德圣安东尼奥 |
1212 |
1134 (6.4%) |
1070 (11.7%) |
西班牙 — 罗斯 |
258 |
239 (7.4%) |
249 (3.5%) |
阿根廷 — 拉班达 |
125 |
111 (11.2%) |
83 (33.6%) |
Mean count error (7 AOIs) |
22.7% |
19.4% |
Ground-truth crown counts from the updated report (2026-10-01). v.2026-09-10 is substantially closer to the true count where the previous model under-detected (La Banda, Madrid, Velilla de San Antonio), but it over-segments dense canopy at Balanga and Cuenca — producing more crowns than ground truth — so its mean relative count error (22.7%) is slightly above v.2026-07-03 (19.4%). ⚠️ The false positives may also indicate the lack of details in the manual labels as the mask-overlap accuracy (IoU / F1) still favours v.2026-09-10 in those areas.
参见
📊 See per-location tree-crown benchmark details (v.2026-09-10) for the area-by-area breakdown, the comparison with v.2026-07-03 and prediction-vs-ground-truth overlays.
Benchmarks - canopy height (CHM)
The Height estimation output (Canopy Height Model, CHM) is benchmarked against lidar-derived ground truth on 5 m hexagons (max aggregation). The current model CHM v.2026-08-31 reduces the mean absolute height error from 4.70 m to 3.24 m (−31%) versus CHM v.2026-07-03 across 38 areas of interest, with the largest gains in tall, structurally complex forest.
参见
📊 See canopy-height (CHM) benchmark details (v.2026-08-31) for the most-improved sample per country, with lidar ground truth and prediction-vs-lidar error maps.