Forest and trees
Trees and vegetation Default model
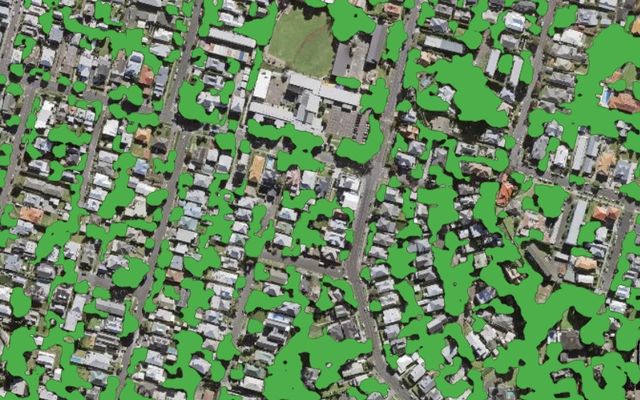
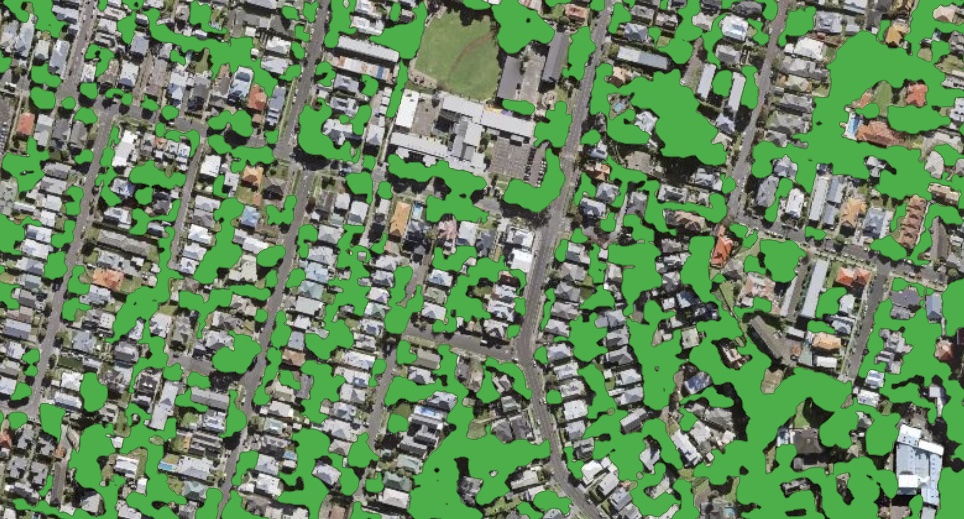
Example result: tree and shrub cover mask.
Cost
8 credits per km² + imagery
Example: 10 km² on Mapbox zoom 18 ≈ 110 credits.
Segments every area covered by trees and shrubs, including sparse forest and shrubland. It works in most environments, cities included. Height classes and individual tree crowns are options you switch on when you start a run.
What you get
A polygon layer of tree and shrub cover.
Works best with
0.6–0.15 m imagery (zoom 18–20) taken in the growing season. Leafless or snow-covered trees are not detected.
Usage examples
Measure canopy cover per district or parcel
Compare two dates to find cleared forest
Build a green-space inventory for a city
- Version
2026-07-03
- Geo domain
Global
- Method
Segmentation
- GSD / zoom
0.6–0.15 m / z18–20
The model is trained on 0.6–0.3 m imagery from different regions and climate zones. Its resolution is enough to find small groups of trees and narrow tree lines. Use imagery from the growing season: leafless trees and snow-covered vegetation are not the target class.
Scenarios with this model
Each scenario is the Forest and trees model with one option switched on. Choose options in the run form of Mapflow Web or the QGIS plugin.
Default run
All tree and shrub cover, down to small groups and tree lines.
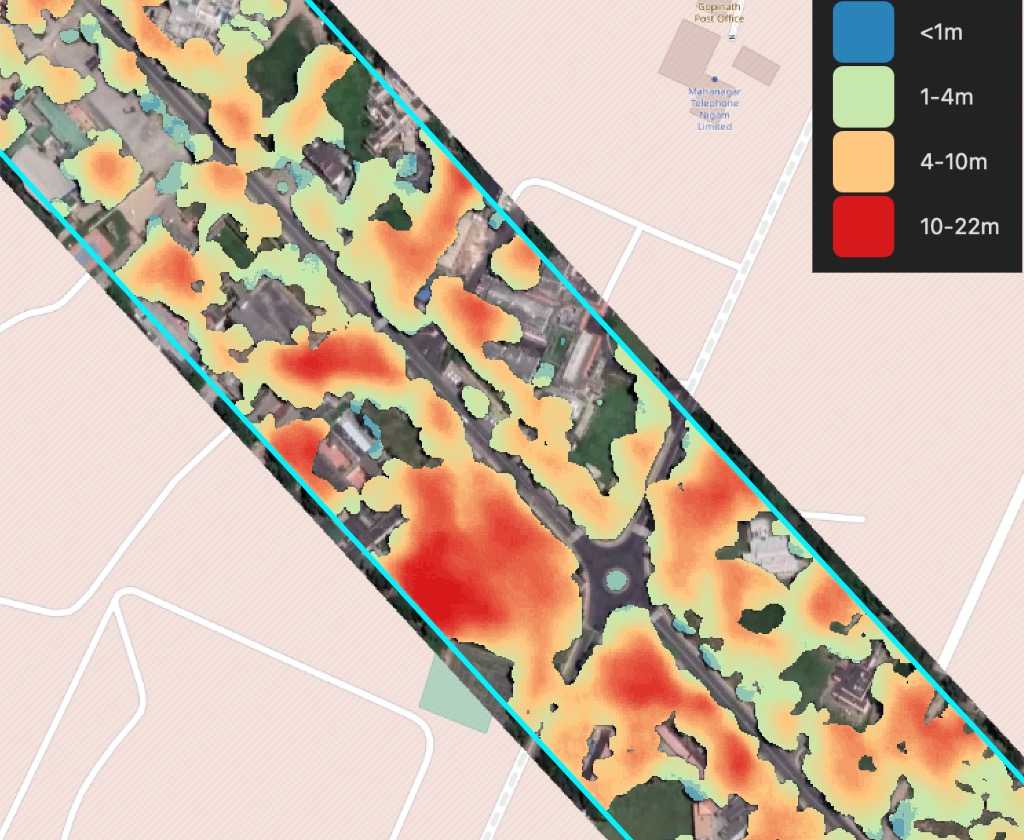
+ Height classes
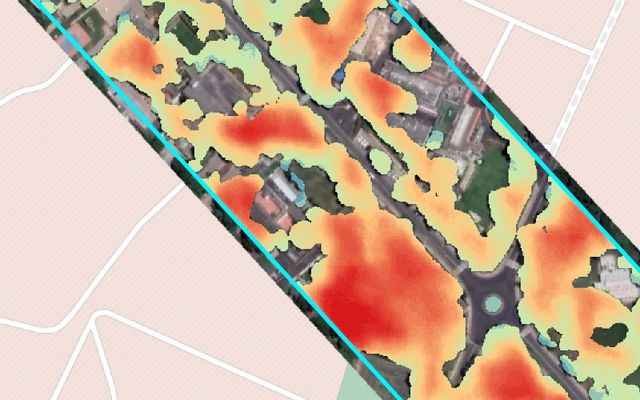
Vegetation split into shrubs, 4–10 m forest and forest over 10 m.
+ Tree crowns
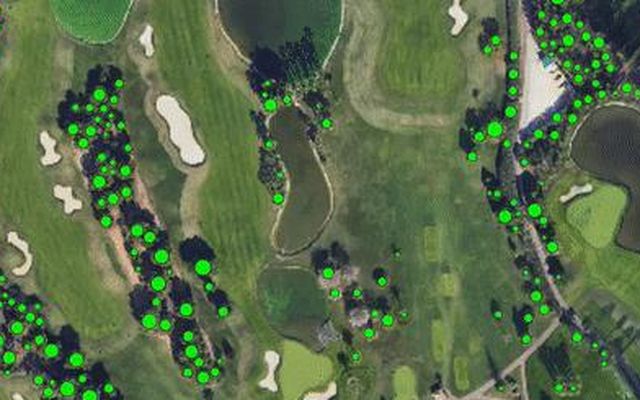
A point for every tree crown, free-standing trees included.
Vegetation height along power lines
Forest and trees + Height classes
Cost
18 credits per km² + imagery
Example: 10 km² on Mapbox zoom 18 ≈ 210 credits.
Runs the forest model with height estimation. Vegetation is classed as shrubs under 4 m, forest from 4 to 10 m and forest over 10 m, which is what vegetation managers need near power lines.
What you get
Vegetation polygons with a height class.
Works best with
0.6–0.3 m imagery (zoom 18–19) taken in the growing season.
Usage examples
Prioritise clearance work in power line corridors
Plan right-of-way maintenance by height class
Screen vegetation along roads and railways
Tip. Buffer your line layer in QGIS (Vector › Geoprocessing › Buffer) and use the buffer as the area, so you pay only for the corridor.
Note
Height classes:
shrubs lower than 4 m;
forest from 4 to 10 m;
forest higher than 10 m.
The classes support vegetation management in power line corridors and similar zones, see the professional solutions by Geoalert. The thresholds can be customized for your requirements.
Count individual trees
Forest and trees + Tree crowns
Cost
13 credits per km² + imagery
Example: 10 km² on Mapbox zoom 19 ≈ 220 credits.
Extracts tree crowns from forest and from single trees, as points with a crown radius or as crown polygons.
What you get
Tree crown points with a radius, or crown polygons.
Works best with
0.3 m imagery (zoom 19) to separate individual trees.
Usage examples
Street-tree and park inventories
Count trees in orchards and plantations
Track tree loss on a construction site
Important
Use 0.3 m imagery (about zoom 19) with the Tree crowns options when you need individual trees.
All options
Sample results

📊 Benchmarks
Forest and trees v.2026-09-10 (Global, segmentation) was evaluated on 8 areas of interest against manually annotated ground truth. Metrics are area-based: IoU is the intersection-over-union of the predicted and ground-truth vegetation masks, and F1, precision and recall are computed on the overlapping mask area. The v.2026-09-10 update refines tree-crown extraction results.
AOI (location) |
Predicted features |
IoU |
F1 |
Precision |
Recall |
|---|---|---|---|---|---|
Italy — Crotone |
254 |
0.862 |
0.926 |
0.944 |
0.909 |
Spain — Madrid |
368 |
0.813 |
0.897 |
0.880 |
0.915 |
Philippines — Balanga |
220 |
0.806 |
0.892 |
0.864 |
0.923 |
Spain — Velilla de San Antonio |
1070 |
0.784 |
0.879 |
0.894 |
0.864 |
Spain — Cuenca |
409 |
0.763 |
0.865 |
0.859 |
0.872 |
Uzbekistan — Tashkent |
156 |
0.730 |
0.844 |
0.905 |
0.791 |
Spain — Rus |
249 |
0.617 |
0.763 |
0.699 |
0.841 |
Argentina — La Banda |
93 |
0.576 |
0.731 |
0.653 |
0.829 |
Global (mean of 8 AOIs) |
2819 |
0.744 |
0.850 |
0.837 |
0.868 |
Area-based IoU / F1 / Precision / Recall measured against ground-truth vegetation masks; segmentation evaluation run 2026-07-03 (unchanged in v.2026-09-10). Compared with the previous version v.2025-06-14 (mean F1 0.513, IoU 0.396).
See also
📊 See per-location segmentation benchmark details (v.2026-09-10) for the area-by-area breakdown, the comparison with the previous version and prediction-vs-ground-truth overlays.
Benchmarks - tree crowns
Latest update — 🌲 Forest and trees v.2026-09-10 (tree crown polygons). The crown-polygon output was evaluated on 7 areas of interest (AOI) against manually annotated ground truth. Metrics are area-based on the crown masks: IoU is the intersection-over-union of the predicted and ground-truth crown masks, and F1 / Precision / Recall are computed on the overlapping mask area.
AOI (location) |
Predicted crowns |
IoU |
F1 |
Precision |
Recall |
|---|---|---|---|---|---|
Italy — Crotone |
254 |
0.842 |
0.914 |
0.930 |
0.898 |
Spain — Madrid |
398 |
0.823 |
0.903 |
0.907 |
0.899 |
Philippines — Balanga |
309 |
0.780 |
0.876 |
0.849 |
0.904 |
Spain — Cuenca |
433 |
0.732 |
0.846 |
0.875 |
0.818 |
Spain — Velilla de San Antonio |
1134 |
0.694 |
0.819 |
0.855 |
0.786 |
Spain — Rus |
239 |
0.689 |
0.816 |
0.759 |
0.883 |
Argentina — La Banda |
111 |
0.624 |
0.769 |
0.700 |
0.852 |
Global (mean of 7 AOIs) |
2878 |
0.741 |
0.849 |
0.839 |
0.863 |
Area-based IoU / F1 / Precision / Recall measured on tree-crown polygon masks; evaluation run 2026-10-01. Compared with the previous version v.2026-07-03 (mean F1 0.824, IoU 0.706).
Tree count accuracy. For tree-counting use cases we also track how closely the number
of detected crown polygons matches the ground-truth crown count. Relative count error is
|detected − ground truth| / ground truth.
AOI (location) |
GT crowns |
v.2026-09-10 detected (count err) |
v.2026-07-03 detected (count err) |
|---|---|---|---|
Italy — Crotone |
327 |
254 (22.3%) |
254 (22.3%) |
Spain — Madrid |
478 |
398 (16.7%) |
368 (23.0%) |
Philippines — Balanga |
193 |
309 (60.1%) |
220 (14.0%) |
Spain — Cuenca |
321 |
433 (34.9%) |
409 (27.4%) |
Spain — Velilla de San Antonio |
1212 |
1134 (6.4%) |
1070 (11.7%) |
Spain — Rus |
258 |
239 (7.4%) |
249 (3.5%) |
Argentina — La Banda |
125 |
111 (11.2%) |
83 (33.6%) |
Mean count error (7 AOIs) |
22.7% |
19.4% |
Ground-truth crown counts from the updated report (2026-10-01). v.2026-09-10 is substantially closer to the true count where the previous model under-detected (La Banda, Madrid, Velilla de San Antonio), but it over-segments dense canopy at Balanga and Cuenca — producing more crowns than ground truth — so its mean relative count error (22.7%) is slightly above v.2026-07-03 (19.4%). ⚠️ The false positives may also indicate the lack of details in the manual labels as the mask-overlap accuracy (IoU / F1) still favours v.2026-09-10 in those areas.
See also
📊 See per-location tree-crown benchmark details (v.2026-09-10) for the area-by-area breakdown, the comparison with v.2026-07-03 and prediction-vs-ground-truth overlays.
Benchmarks - canopy height (CHM)
The Height estimation output (Canopy Height Model, CHM) is benchmarked against lidar-derived ground truth on 5 m hexagons (max aggregation). The current model CHM v.2026-08-31 reduces the mean absolute height error from 4.70 m to 3.24 m (−31%) versus CHM v.2026-07-03 across 38 areas of interest, with the largest gains in tall, structurally complex forest.
See also
📊 See canopy-height (CHM) benchmark details (v.2026-08-31) for the most-improved sample per country, with lidar ground truth and prediction-vs-lidar error maps.
Need a different object?
We train custom models on your imagery and classes, and connect them to your Mapflow account.